Building a Custom Viz Extension with Claude
This week I attended two workshops that stuck with me.
-
Sam Fife presented his TC26 session on 10x-ing Your Tableau Workflow with AI and Claude Code.
-
Eric Summers hosted a hands-on session on building viz extensions.
Both landed on the same point: AI has made it easier to move from an idea to production.
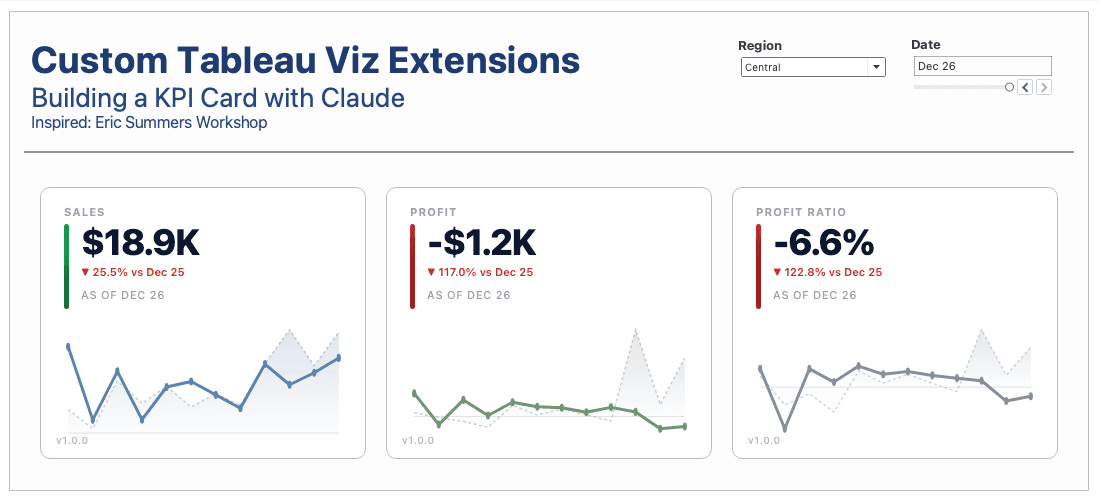
Last week I built this website from scratch without writing a line of code. This week I wanted to go further. I've long wanted to try building Tableau viz extensions — never had the time, the confidence, or honestly the knowledge. After Eric's workshop I gave it a go and within an afternoon, I had this viz extension
And on a dashboard they looked like this:
A custom solution
I had the wrong idea going in.
A Viz extension is not about reinventing Tableau. I don't know why I thought it was - the answer is right there - they are called Custom Viz Extensions. You're building something bespoke. You aren't trying to compete with Tableau's own mark types.
Custom Viz Extensions are specific to a problem, a team, a set of dashboards. Not a general-purpose chart type. Something tailored.
I learned this the hard way. The KPI card was not my first attempt.
I started with a "Super Table" viz extension - a rebuild of the crosstab from scratch with every option imaginable. I wanted total control over every cell but quickly got buried in requirements and couldn't debug even simple things.
The KPI card is the opposite. It solves one specific, painful problem. That focus is what made it work.
There are lots of use cases - but one that stood out to me was:
Can I design a KPI card that is easily recreated in all my team's reporting? Can I make it easy to use, repeatable and consistent?
Why a KPI card is the perfect first viz extension
Here's what building a proper KPI card in Tableau normally involves:
-
A calculated field for the BAN value
-
A calculated field for % change vs. last year
-
A calculated field for % change vs. prior month
-
Many calculated fields for goals, performance against goals, not hitting goal etc.
-
A second sheet for the trend line
-
A dashboard to stitch it all together
-
Another calculated field when someone asks "can we see this by week?"
And every analyst builds things differently. If you gave 5 analysts the same requirements, you end up with 5 versions of the same card that look subtly different and break in different ways.
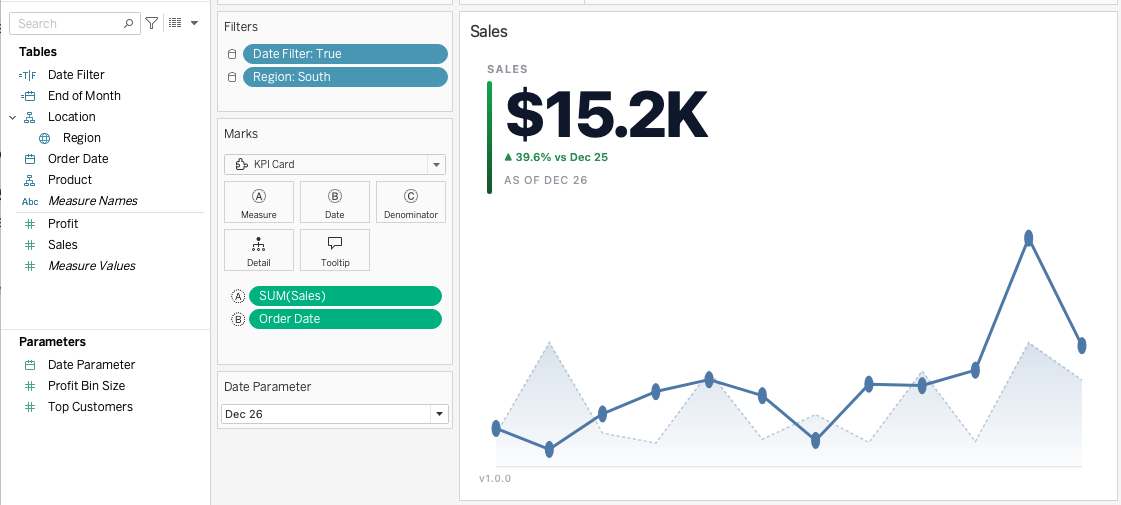
The viz extension removes all of that. Drag a measure onto the Measure shelf. Drag a date onto the Date shelf. Done — the % change calculations, the trend chart, the year-over-year comparison are all built in.
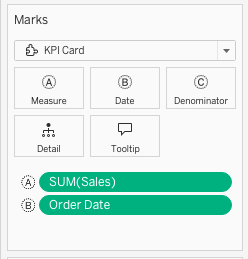
Two fields. That's it.
The extension then takes care of all those calculations and drawing of the BAN. As you can see, there's no extra fields going into my data pane.
The settings panel is where it gets interesting
You don't just build the visualization, you build the settings too - and this bit was so fun.
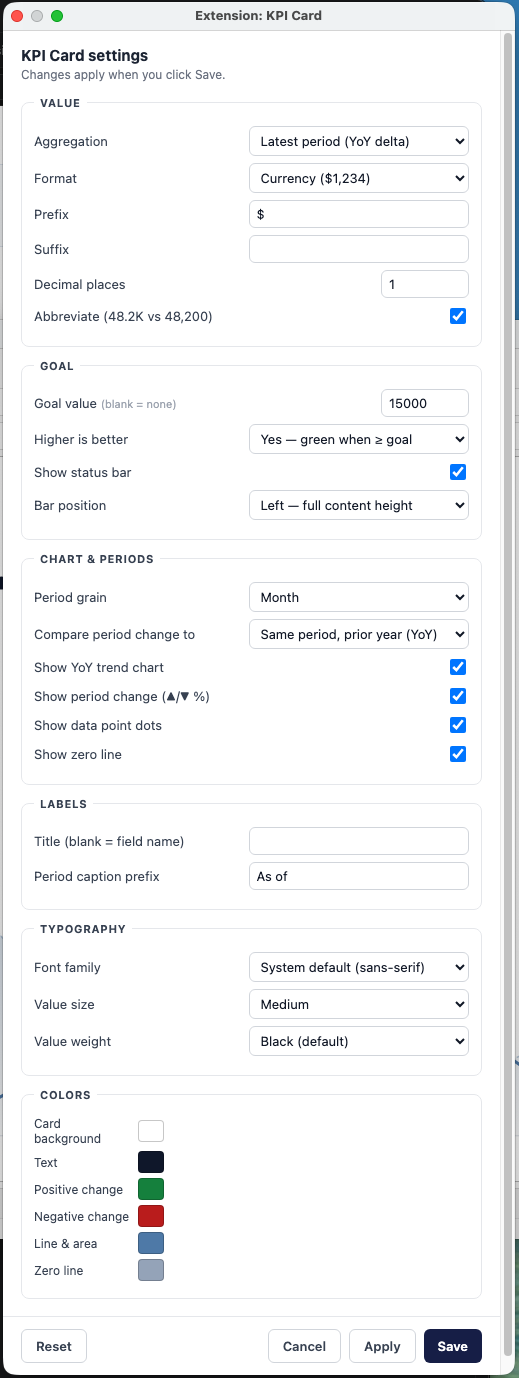
Number formatting. Currency, percentage, plain number, or custom with your own prefix and suffix. Decimal places. Abbreviation toggle so $85,175 becomes $85.2K. One dropdown, no calculations.
Comparison mode. Year-over-year or period-over-period at the click of a button. In vanilla Tableau, those are two different table calculations. Here it's a toggle.
Goal tracking. Set a target value directly in the settings. Tell it whether higher is better or lower is better. The status bar handles the rest — no calculated field comparing your metric to your goal.
Period grain. Switch between day, week, month, quarter, year. The trend chart and delta update instantly.
Colours and typography. A full palette picker with curated families — Tableau 10, Tableau 20, Miller Stone, Nuriel Stone, Colour Blind-friendly. Custom up/down colours. Font family. Value size. Everything your design team might want to lock down, or your analysts might want to personalise.
The Apply button means changes update live behind the dialog — no closing and reopening to see the result. The dialog itself is moveable and resizable. Small details, but they make it feel like a real product.
Now - I probably shouldn't have put all these options in. All that flexibility is exciting to build, but if the goal is to deploy this across a team for consistency, you probably don't want every analyst picking their own fonts and comparison modes. But Claude allowed me to get very granular with instructions - including spending too much time on this small, but beautiful nest colour menu
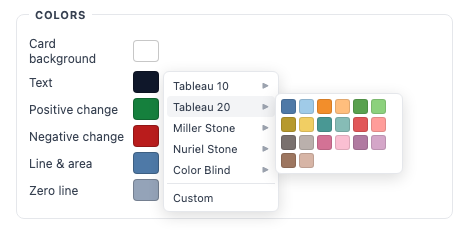
So yes, I over-engineered the settings — but that's the point. You can build exactly as much or as little as your use case needs. Lock down the defaults, expose only what needs to flex per use case (maybe just the goal value), and the card just works the same way everywhere. That decision is yours to make, and it doesn't have to be made upfront.
The calculations move out of Tableau
It took me longer than I'll admit to realise this.
The aggregations are not done in Tableau, they move into your viz. This is a good and a bad thing.
-
Good - all those extra YoY, MoM, Performance against Goal move into the Viz and you don't have worry about them
-
Bad - If you aren't careful, your extension's math might be off.
Here's some examples I ran into.
The timezone bug. At one point, Sales in the extension ($79.8K) didn't match Tableau's own line chart ($85.2K) for the exact same month and filter.
The culprit: Tableau passes dates as UTC-midnight Date objects. In a UTC-negative timezone, midnight UTC on December 1st is 7pm November 30th local time — so every order placed on December 1st was being bucketed into November. A $5.3K gap, explained entirely by a timezone offset.
This is the kind of bug you cannot fix in someone else's extension. Because I built it, the fix took ten minutes.
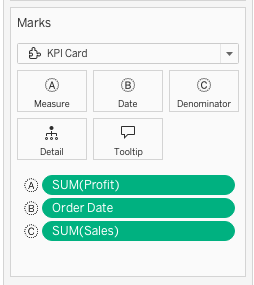
Row-level calculations. Dragging AGG(Profit Ratio) — defined as SUM([Profit])/SUM([Sales]) — onto the Measure shelf won't give the right answer. The extension receives row-level data from Tableau (one row per order), and summing individual order-level ratios produces a wildly inflated number.
The solution is a dedicated Denominator shelf. Drag Profit onto Measure, Sales onto Denominator, and the extension computes SUM(Profit)/SUM(Sales) per period correctly. For more complex ratios, you may need separate numerator and denominator calculated fields — but once you understand the pattern, it's straightforward.
Why build your own instead of using someone else's?
Make it yours. Company colours, standard fonts, the specific metrics your team reports on every week. No off-the-shelf extension knows your business.
You own the iteration. You can't email a third-party developer and ask them to tweak the delta arrow colour. When you own the code, you own the roadmap — and with Claude Code, the iteration loop is fast enough to happen in real-time with your team.
Security. You built it, you host it. Work with your own IT team to deploy on your own infrastructure. There's a persistent unease in enterprise settings about data flowing through externally-hosted extensions, even sandboxed ones. Building your own removes that conversation.
How long did it take?
About six hours — but that's inflated. A chunk was tweaking settings I didn't need to tweak. Another was debugging the aggregation issues, which wouldn't happen with a cleaner starting measure. Realistically, three hours to something genuinely usable.
Here's what gets me: I could not have done this two weeks ago.
Tableau Viz extensions have existed for years. The barrier was never the concept — it was "do you know JavaScript well enough to build one?" That question is gone. Now the barrier is "do you know what you want to build?" That's a question a lot more people can answer.
Want to try it yourself? Here's how to start
What you'll need
-
VSCode — Claude Code integrates directly into it, and having your browser preview, terminal, and AI assistant all in the same window rather than jumping between apps makes a real difference
-
Claude Code — install it as a VSCode extension or run it from the terminal
-
Tableau Desktop — the free version works fine; this is different from Tableau Public Desktop, which doesn't support viz extensions
-
Node.js — to run the local development server
Step 1 — Create a project folder
Make a new folder for your extension and open it in VSCode. Launch Claude Code from the integrated terminal.
Step 2 — Enter Plan mode
Before Claude writes a line of code, switch to Plan mode. Describe what you want to build: the viz type, the data it needs, any settings users should be able to change. This is requirements-gathering, not coding — get your thinking straight here and the build goes much faster.
Step 3 — Let Claude scaffold the project
Once the plan is agreed, Claude will generate everything: the main JavaScript file, the CSS, a .trex manifest file (how Tableau finds your extension), and a local HTTPS server. Tableau requires HTTPS for extensions — Claude handles the setup.
Step 4 — Run the server and load in Tableau
Start the server (npm run tableau or whatever Claude named the script). In Tableau Desktop, create a new sheet, select the Extension mark type, and load your .trex file. Your extension renders live.
Step 5 — Iterate
This is the part that's genuinely different with Claude Code. See something off — describe it. Want a new option — ask for it. The feedback loop is fast enough to work in real time. Keep scope tight, agree changes in Plan mode before implementing, and you'll move quickly without getting lost.
Getting it into production
Everything above gets you to a working extension running locally. Getting it in front of your team or embedded in a published workbook takes a few extra steps — and they vary depending on where you're hosting.
The simplest path for a personal or small-team setup: deploy to Vercel. It's free, handles HTTPS automatically, and takes minutes to set up from a GitHub repo. Point your .trex manifest at the Vercel URL instead of localhost and you're done.
For enterprise deployments — hosted internally, behind a firewall, or through Tableau Cloud — there's more involved: your IT team, SSL certificates, network access rules. Claude can help you think through the options, but the specifics will depend on your environment. The code itself doesn't change; it's purely an infrastructure question.
Try the KPI card yourself
The extension is live and hosted — you can load it into Tableau Desktop right now without writing a line of code. This is just to give you a feel for how viz extensions work and what's possible. Drag in Superstore, drop Sales onto the Measure shelf and Order Date onto the Date shelf, and you'll have a working KPI card in under two minutes.
What you'll need
- Tableau Desktop — the free version works. This will not work with Tableau Public Desktop.
- A data source with at least one measure and one date field — Superstore works
Steps
- Download the extension manifest: kpi-card.trex
- Open Tableau Desktop and connect to your data source
- Create a new sheet and change the mark type to Extension
- Click My Extensions and load the downloaded
kpi-card.trexfile - Accept the prompt — the KPI card will appear
- Drag a measure onto the Measure shelf and a date onto the Date shelf
That's it. Settings, formatting, and goal tracking are all available via the ⚙ button on the card.
If you want to build your own version or use this as a starting point, the full code is on GitHub — including a deployment guide for hosting your own.
This extension is provided for demonstration purposes only and is not recommended for production use in live dashboards or business-critical reporting. It is offered as-is, without warranty of any kind. Use at your own risk — I am not liable for any issues, data discrepancies, or losses arising from its use.