
· 6 min read
DZV is EZ
Dynamic Zone Visibility is a simple way to build great dashboards. Here we break it down into 3 easy steps and walk through a few example use cases.
Tableau TechniquesTableau User GroupsHow to
Read Full Article →Explore articles about Tableau tips, tricks, and best practices for data visualization.
Dynamic Zone Visibility is a simple way to build great dashboards. Here we break it down into 3 easy steps and walk through a few example use cases.
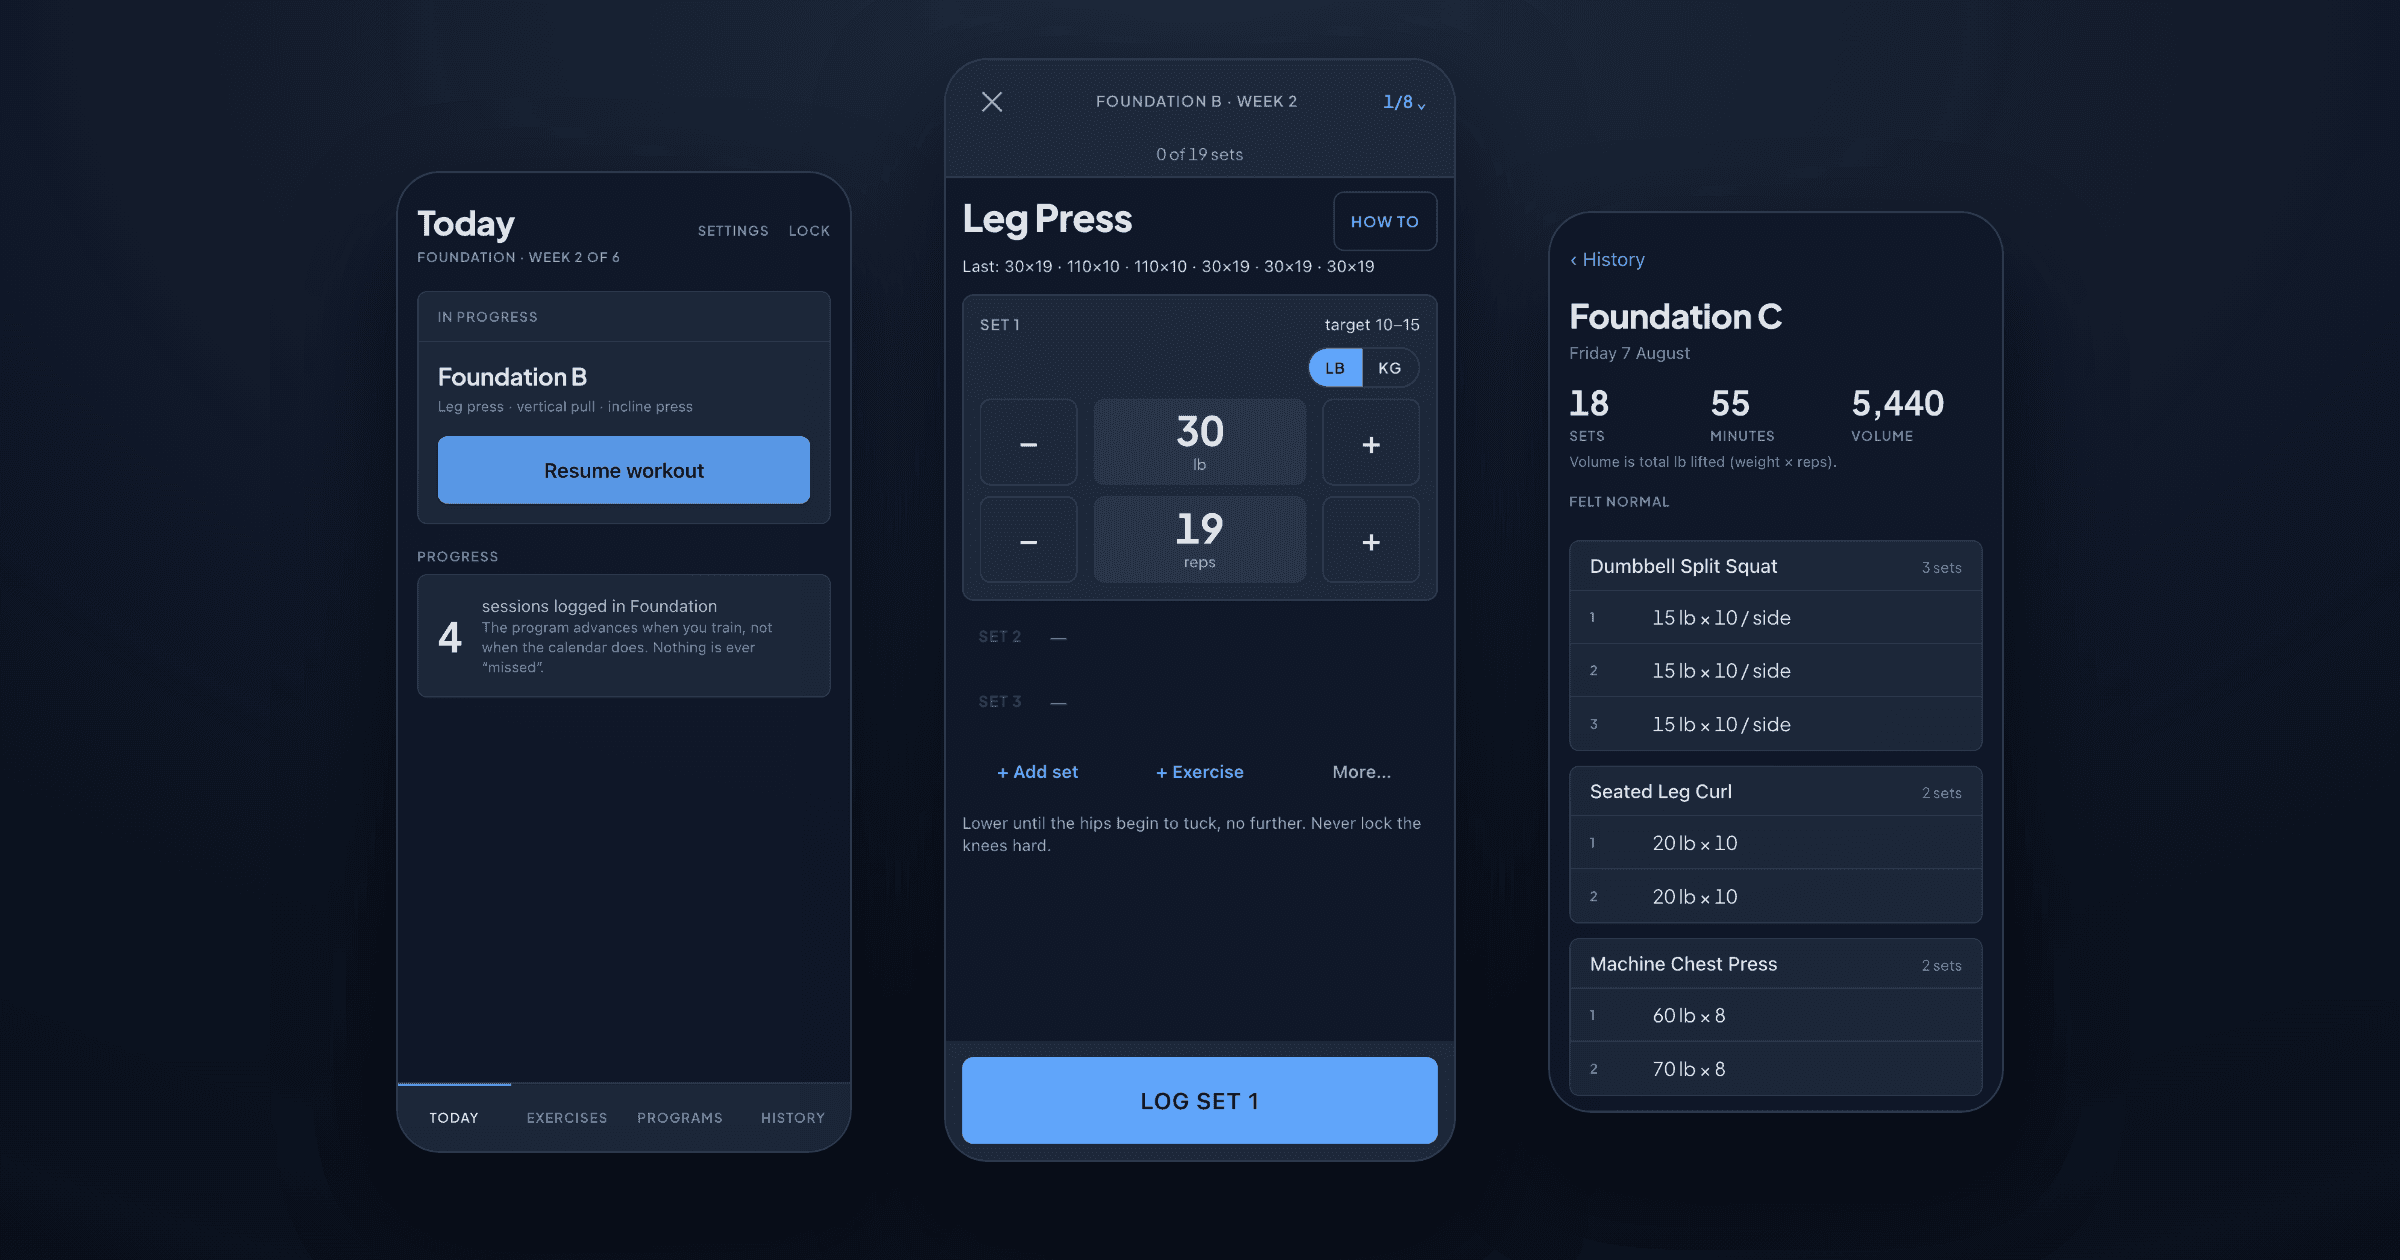
Four viz extensions in, it clicked: a viz extension is just HTML in a box. So is an app. So I built a training log for a 44 year old coming back to the gym, and pointed it at a database Tableau can read.
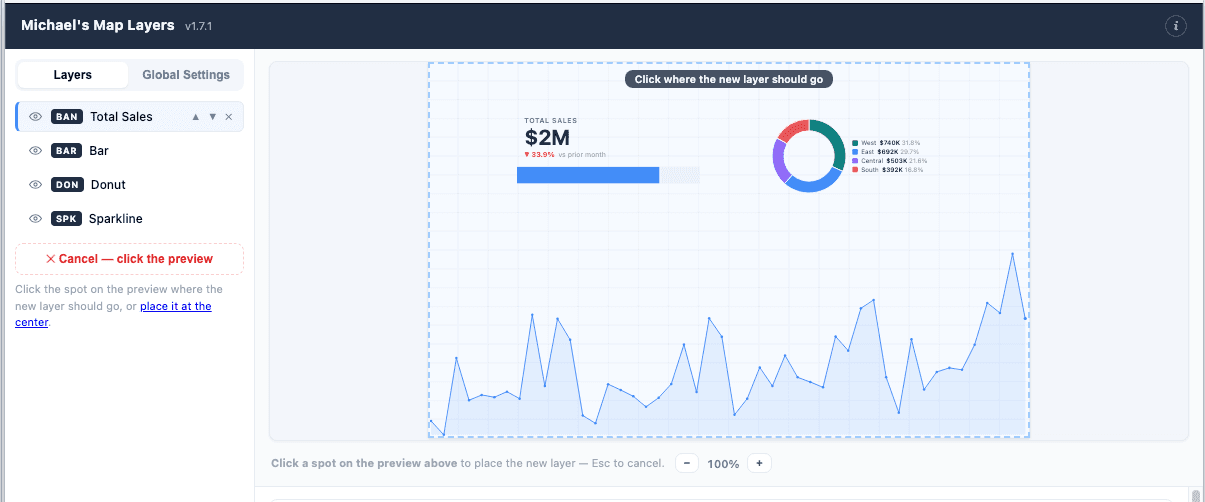
A viz extension that replaces the classic map layers technique (MAKEPOINT, a blank map, and a pile of calc gymnastics) with a plain x,y canvas. Pick a point with you mouse, draw something there, repeat.
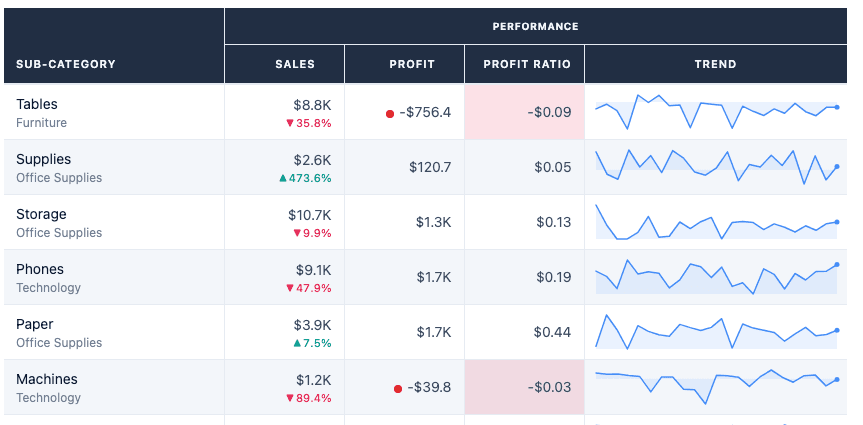
A complete how-to guide for the Super Table viz extension: from loading your first .trex file to building fully formatted, conditionally coloured tables with sparklines and period-over-period comparisons. No calculated fields required.
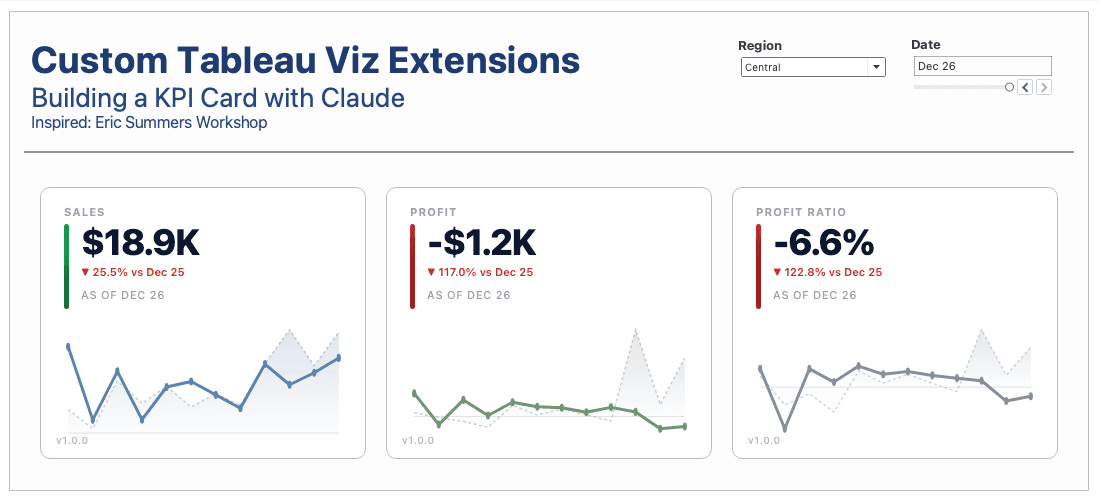
This week I attended two workshops about AI and Tableau. Then I built a custom KPI card viz extension in an afternoon. Here's what worked, what broke, and why you should consider building your own.
Everyone keeps saying AI can build anything. I decided to find out. Here's what happened when I handed the keys to Claude Code and asked it to build me a personal website from scratch.