View on Tableau Public ↗
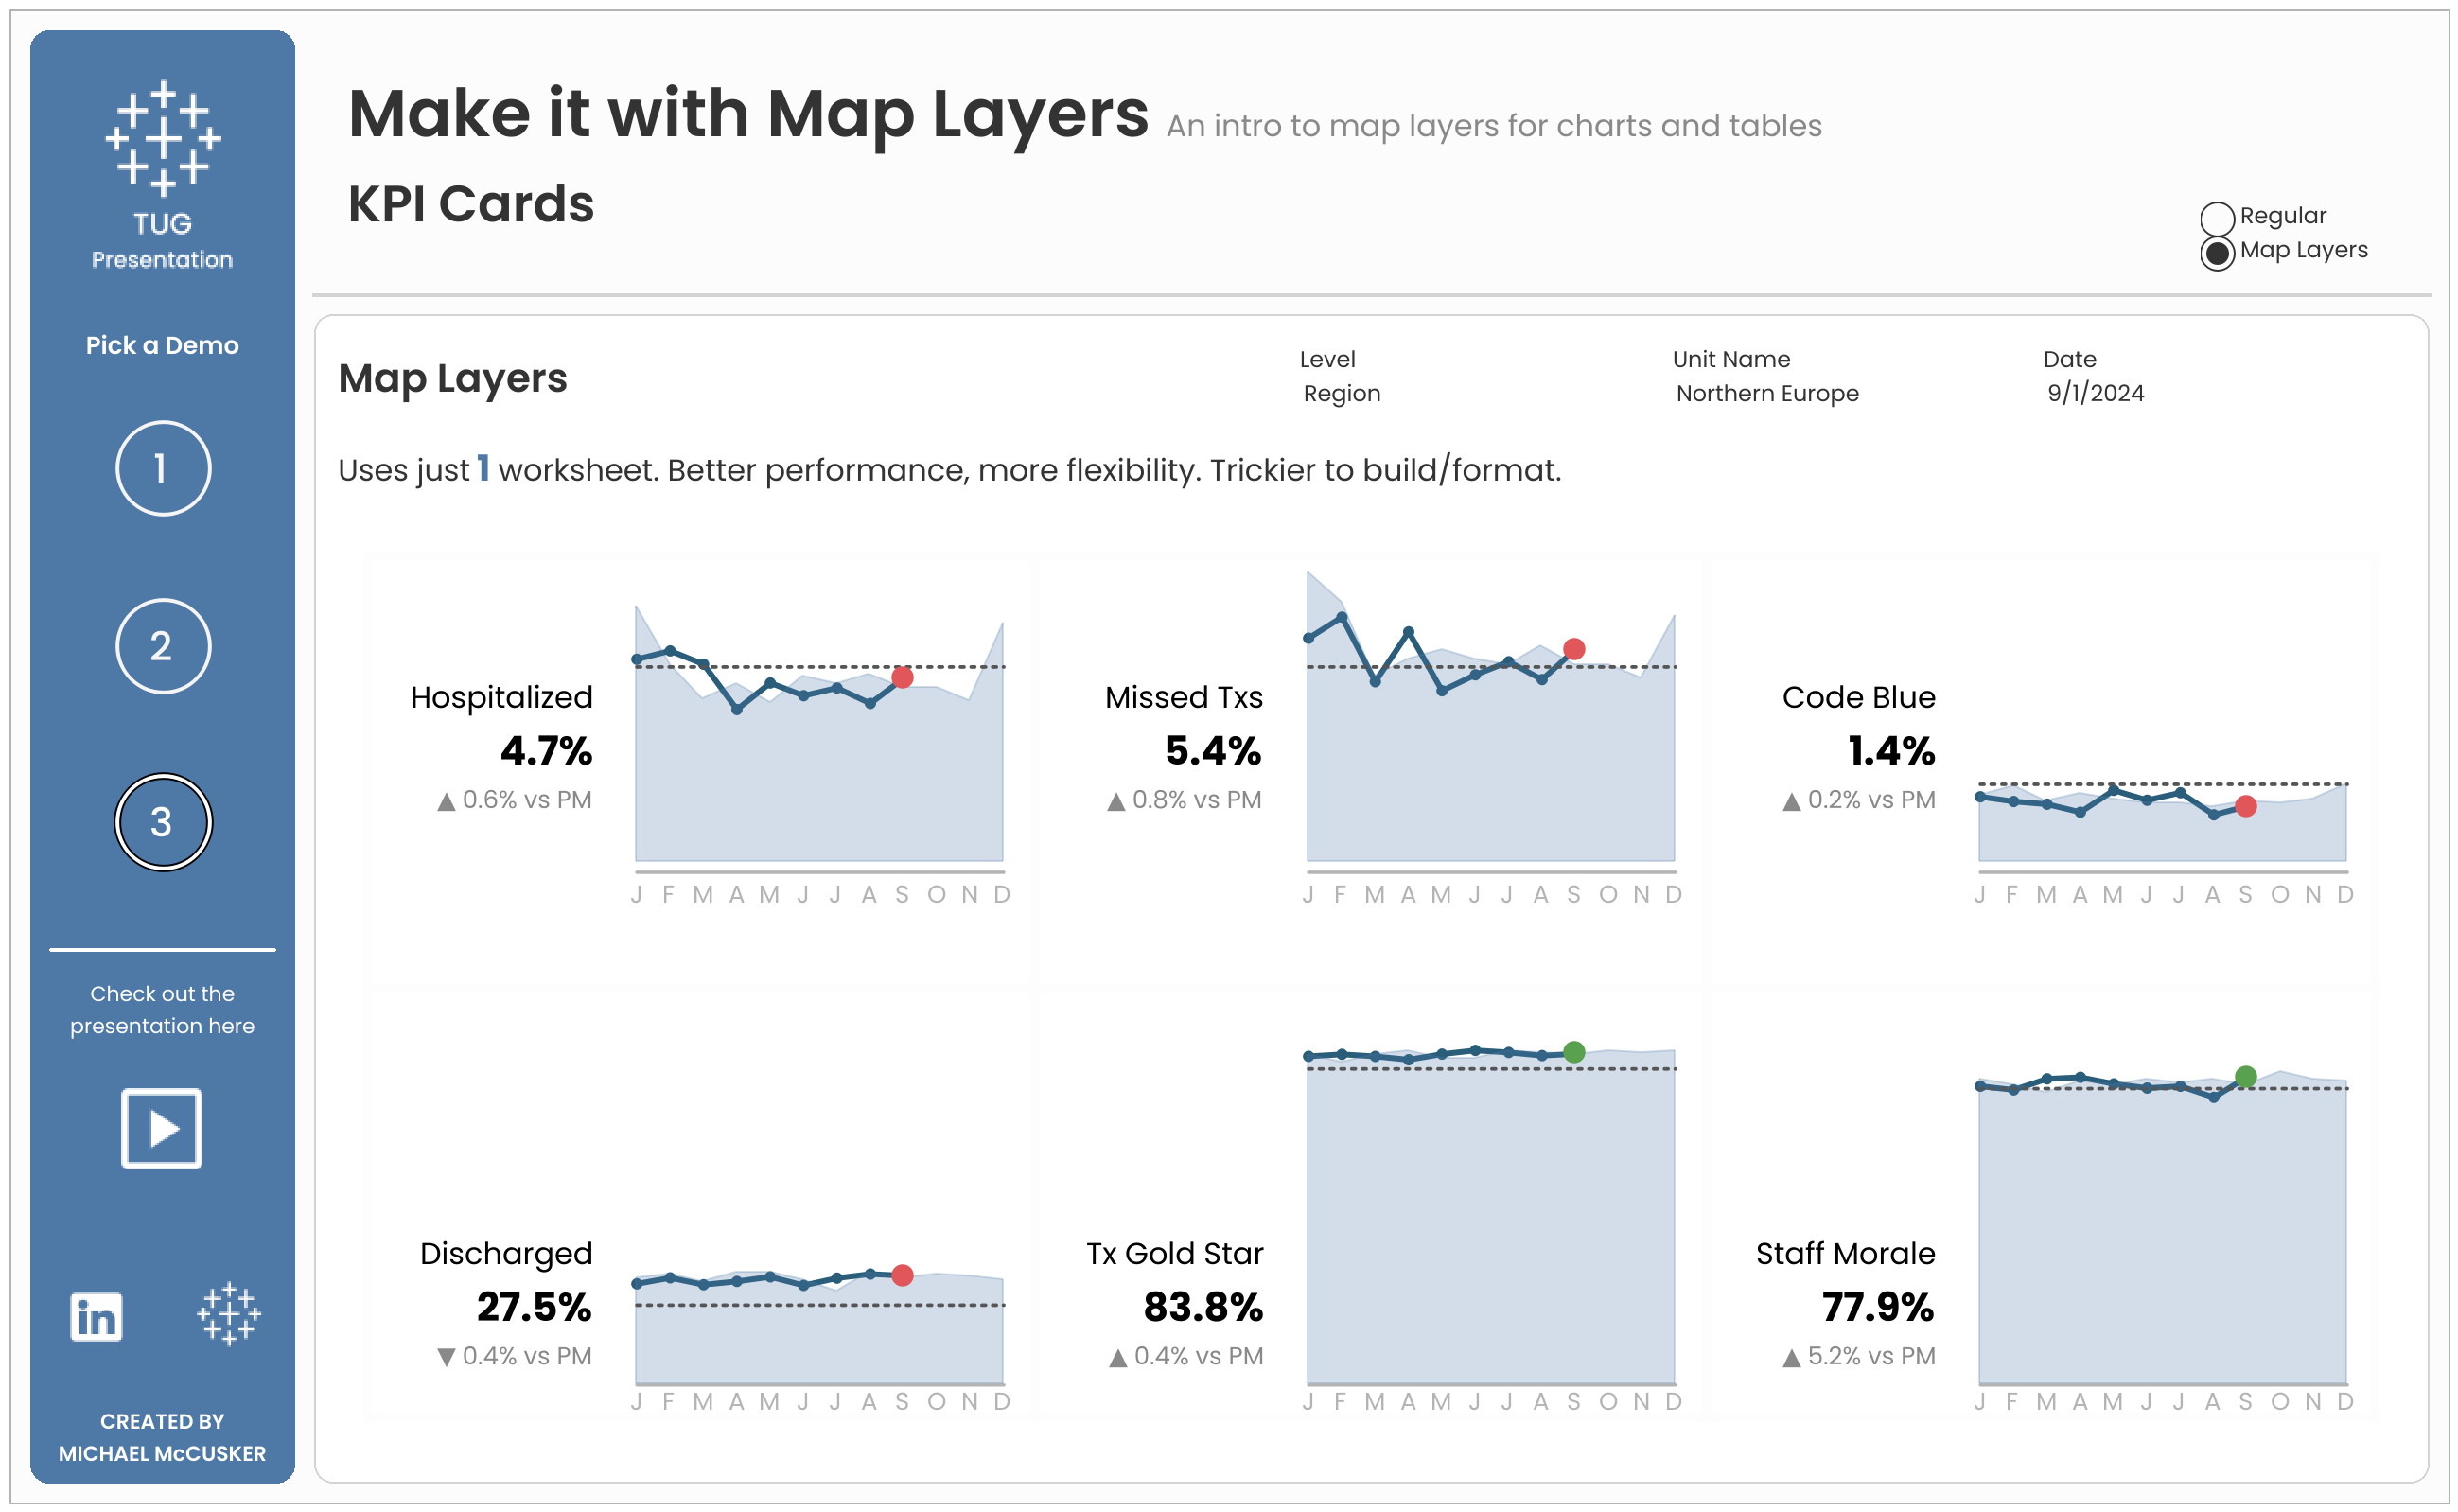
Make it with Map Layers
A dashboard used in my Make it with Map Layers Presentation. Build 3 simple charts and tables using Map Layers and compare them to building them using out-of-the-box Tableau functionality.
TableauVOTDMap Layers