DZV is EZ

Dynamic Zone Visibility is arguably my favorite feature of Tableau.
There are a lot of reasons to love it. The first of those is the name. Dynamic. Zone. Visibility. That is objectively a cool phrase. If this were Scrabble (the coolest of all the board games), we are scoring a lot of points with the words Dynamic Zone Visibility!

Another reason is that it is one of those features that looks complicated, but is very simple to apply. Or DZV is EZ, if you like.
User Groups and TC26
I've shared this presentation at a number of Tableau User Groups and at TC26. Very grateful to Chris McClellan at the Team Datafam Tableau User Group for hosting the first version of this talk and posted the recording here.
Sadly, it was not a recorded session at TC, but I gave this talk to Tore Levinsen and Prasann Prem's excellent Tableau Buddy Sandbox group shortly after:
DZV is EZ - Master Dynamic Zone Visibility in 3 steps
Try overlook the dashboard images breaking in front of your very eyes. Live demos are fun.
What is DZV?
DZV is just a way for us (developers) to show or hide something on a dashboard based on what our user clicks on.
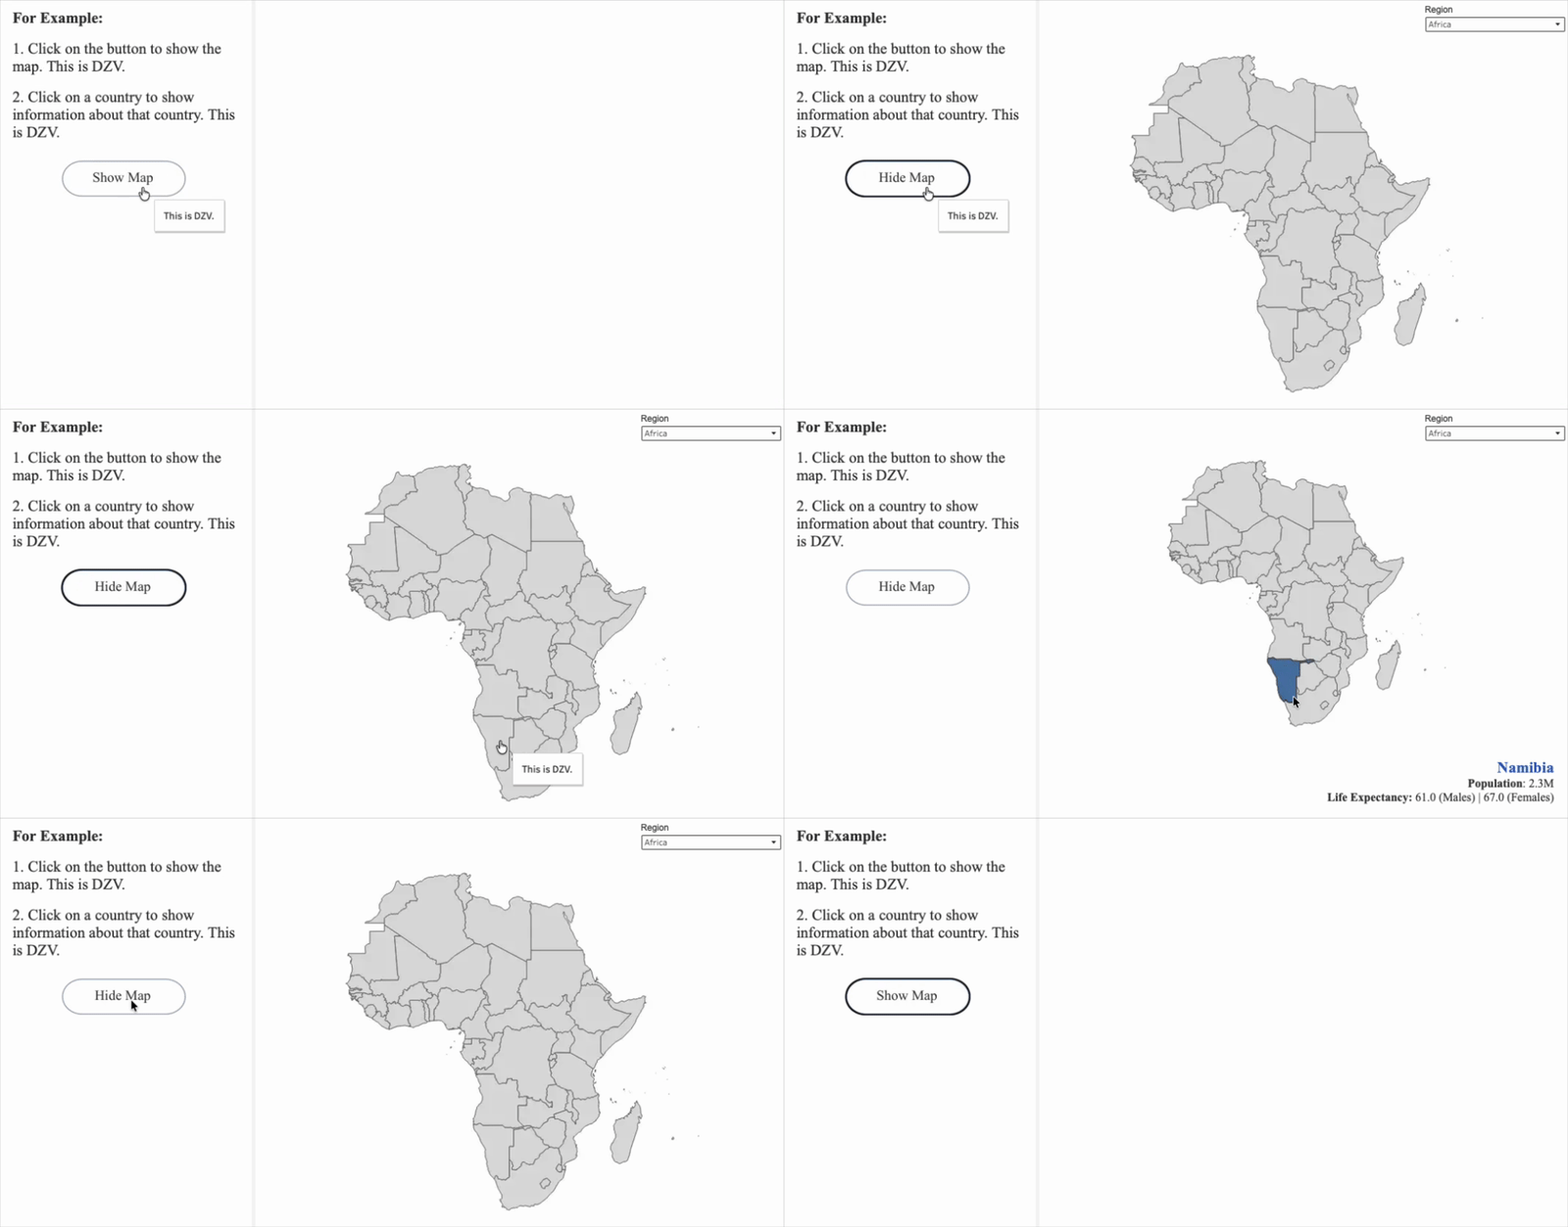
It is such a versatile tool that can turn dull, static reports into interactive and engaging dashboards - putting your user in the driving seat.
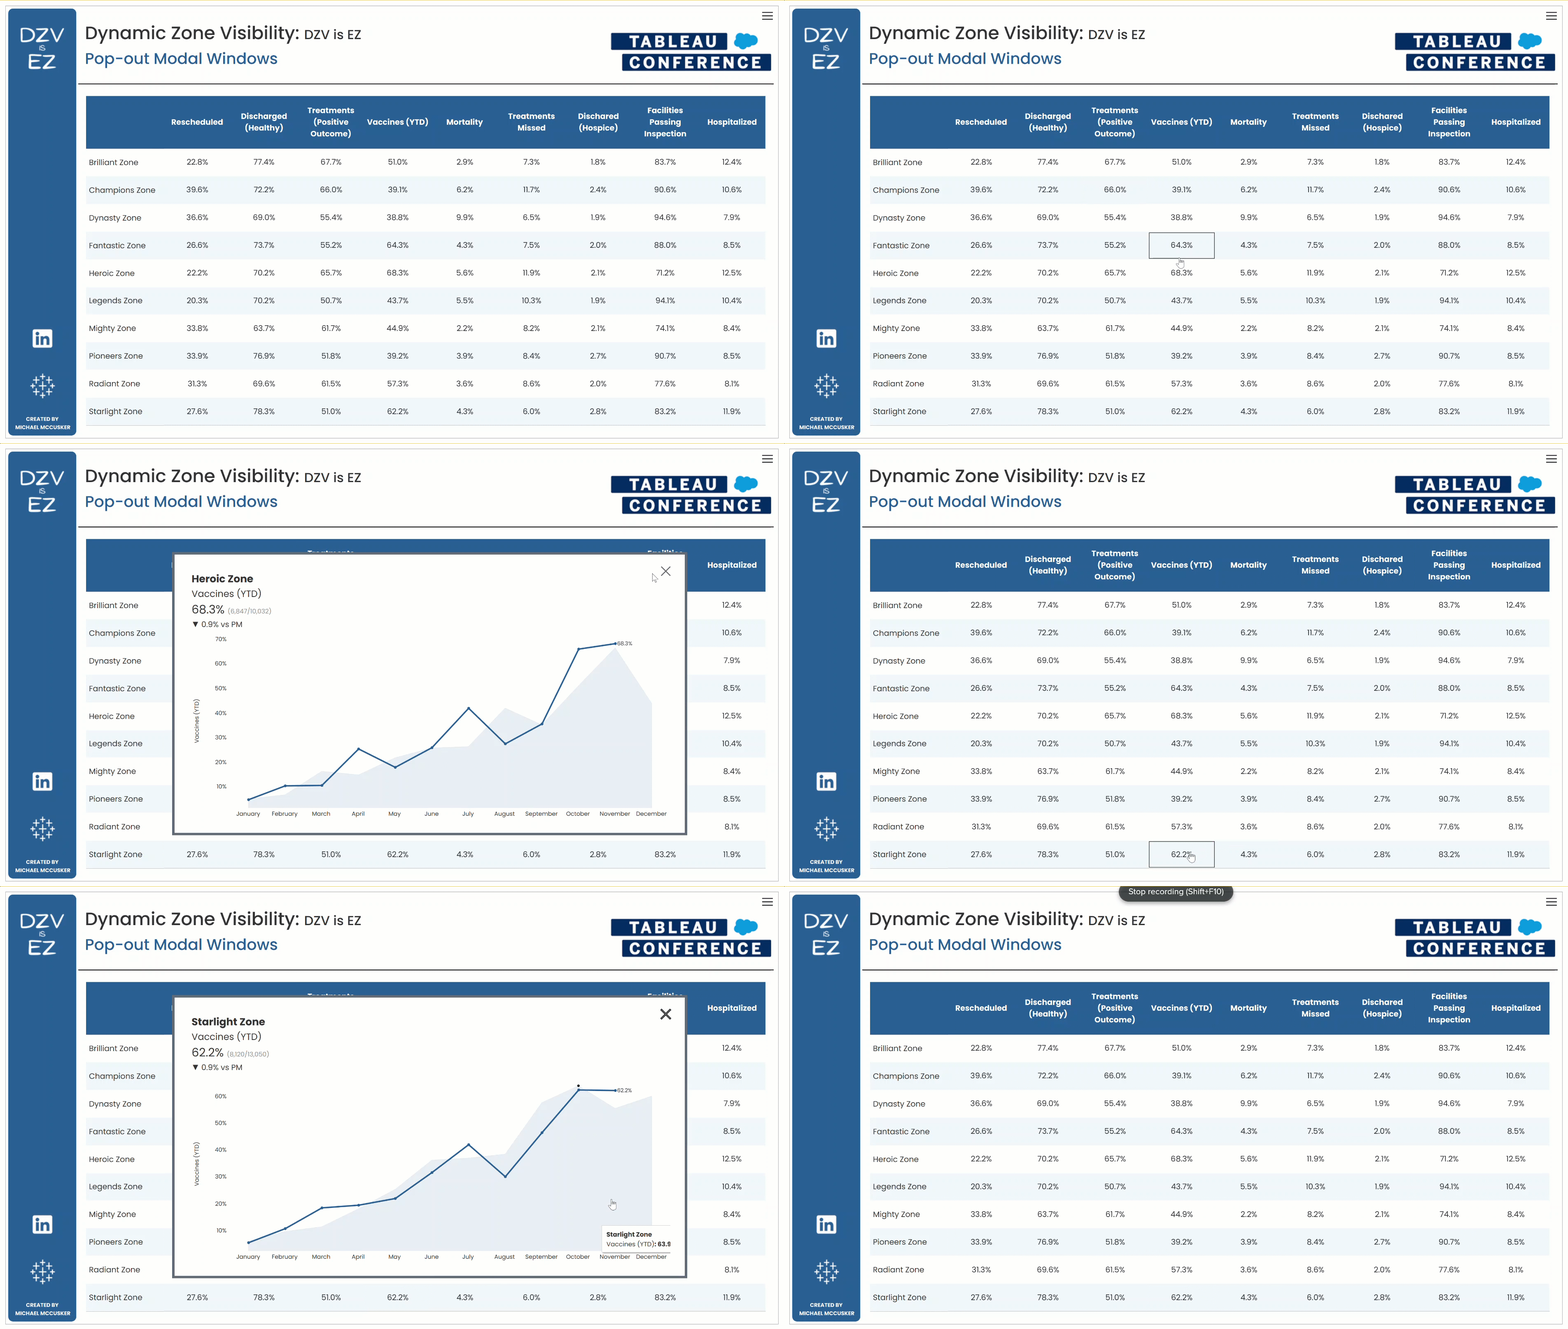
Looks complicated though. Right?
DZV is EZ
When Dynamic Zone Visibility was first released, I assumed that because it looked impressive as an end user, it must be complicated for developers.
As it turns out, Dynamic Zone Visibility is very easy to apply. It can be achieved in 3 steps.
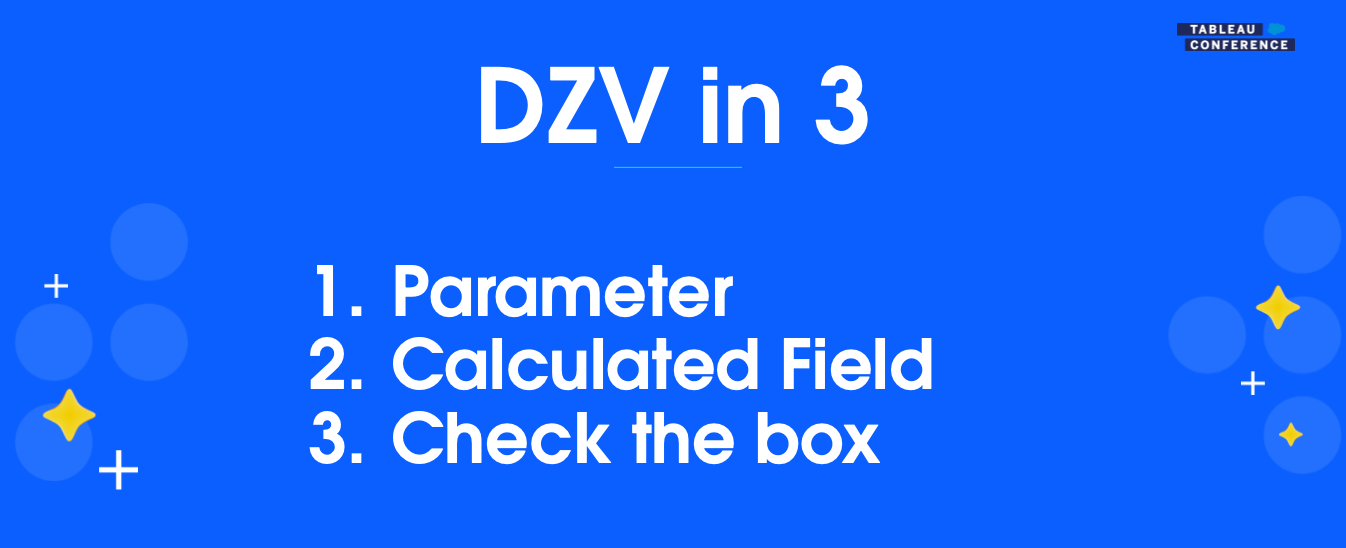
DZV in 3
There are a lot of uses for DZV - but for all of them, it only takes 3 steps.
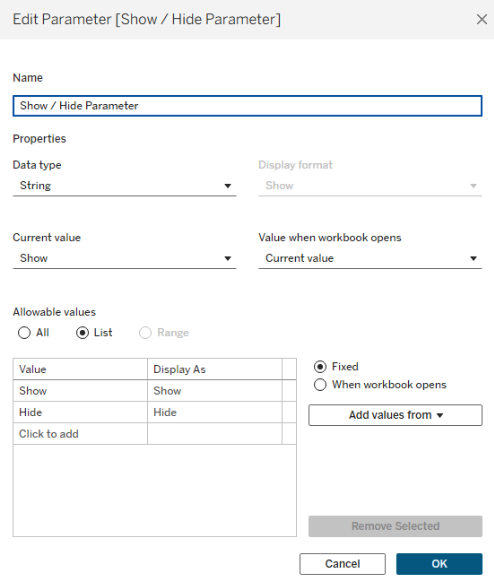
1. Create a Parameter
I love parameters. I like to think of them as empty boxes that we can put anything in.
2. Create a Calculated Field
This calculated field will talk to the parameter from step 1. It should be a True/False statement and should not reference any fields in your actual data set.
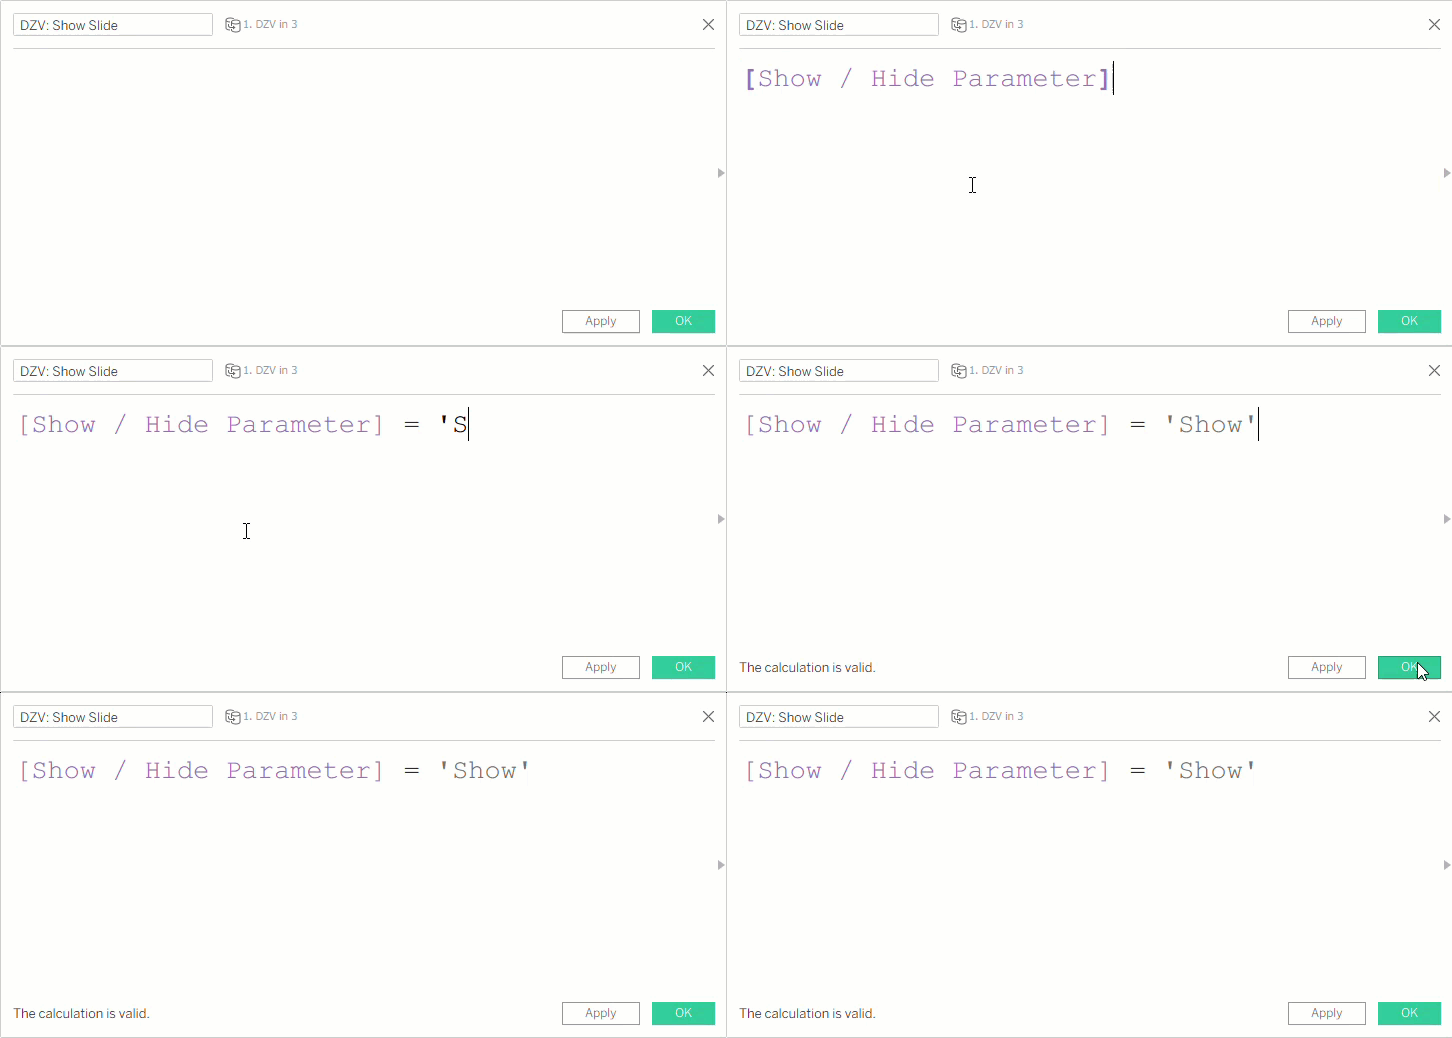
3. Check the box
Highlight whatever you want to show/hide and check the box in the Layout Pane and pick the calculation from Step 2.
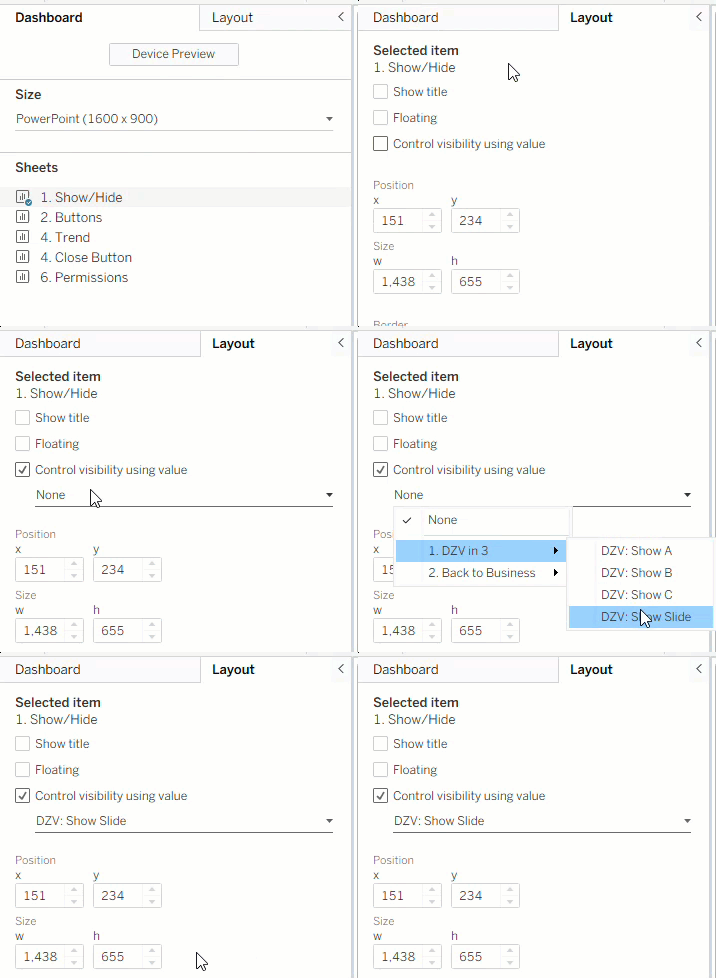
Getting Started
Using DZV in 3 to show or hide this cheat sheet.
If you've used Tableau for a while, you may be saying - but that's just Sheet Swap, right?
Stepping it up
DZV can be used on anything on your dashboard. Not just worksheets. This is what makes it better than sheet swap.
In this next example, we have a combo of worksheets, text boxes and images all within a container. When they are all on the dashboard, they are all crammed together and can't be read. Using DZV, we can guide our users through each option one at a time. Here we want to present vital information about potential host cities for TC27.
This time, we create 3 calculated fields, one for each toggle option. Then apply the DZV to the container.
This was a slightly more complex example. But notice the DZV was still the exact same as first example. Still DZV in 3.
The extra complication came from adding buttons with Parameter Actions.
Parameter actions are your path to super-charging your DZV.
Business use case
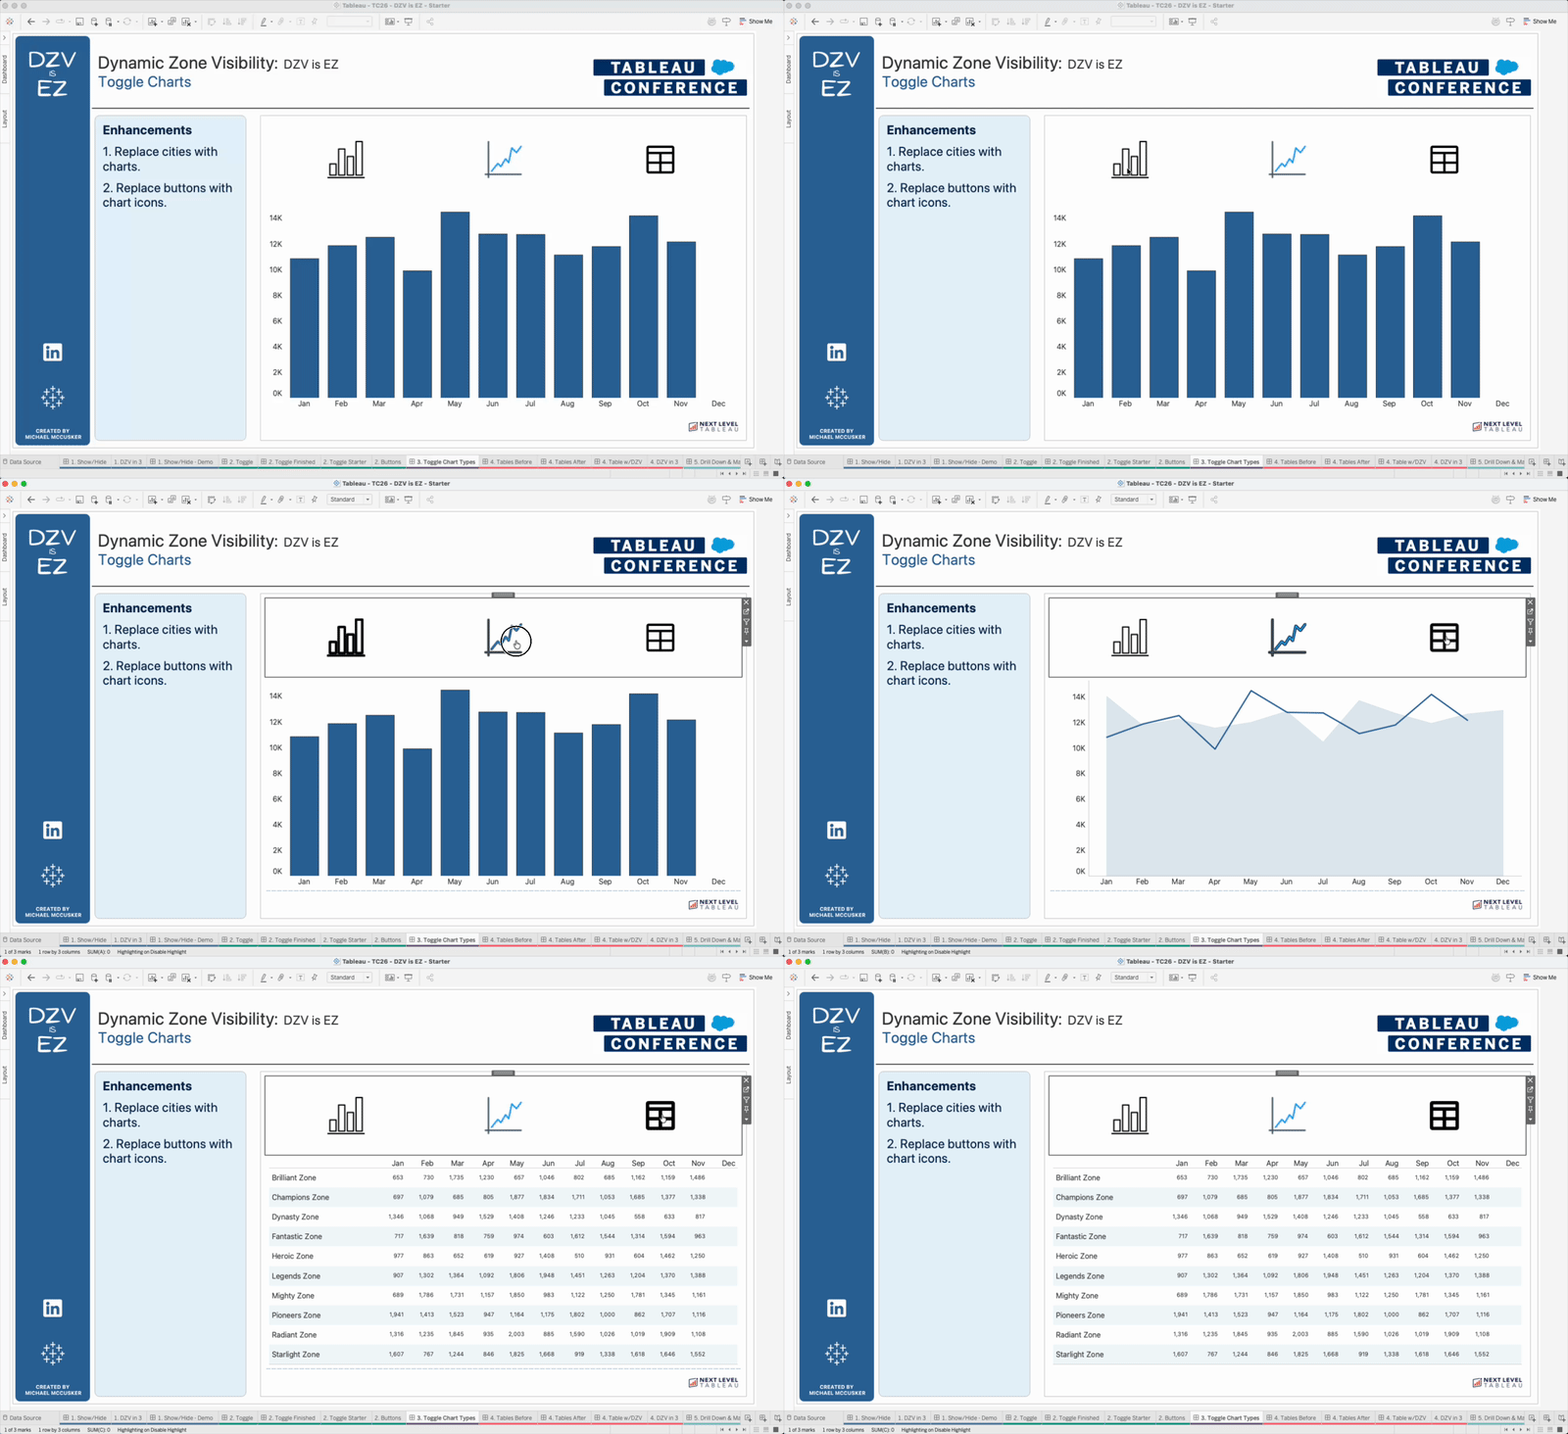
That last example was a fun one using coffee, theatre and TC kick-off events. But it can easily be turned into a business use case where instead of cities you could offer your users a way to toggle between different viz types. (Credit Andy Kriebel, Next-Level Tableau)
Pop-up Modal Windows
I'm not a fan of tables in Tableau. I used to have this table where it was my job to go and add 'insights' into the tooltip. It wasn't my favorite.
Thankfully DZV came to my rescue. I stopped needing to update tooltips and instead created dynamic and insightful pop-up modal windows.
I use parameter actions to pass the name of the Zone (on rows) into a Zone Parameter, and the name of the Metric (columns) into a Metric Parameter.
Then we can use Dynamic Zone Visibility to add a dynamic pop-up trend chart.
The key here is to have one of the parameters accept the word 'HIDE'. Then use the X to put 'HIDE' into that parameter.
Although more complex it is still DZV in 3:
-
Parameter - borrow one of the existing ones, no need to create a new one.
-
The calculated field is a little different this time, it checks when our parameter does not equal 'HIDE'.
-
Check the box on the both the trend worksheet and the x worksheet. Another cool feature, your DZV calculation can be used on multiple objects. It is not one-time use.
DZV in 2
I love this next example. The DZV happens before Tableau even opens. It is based on who is looking at the dashboard.
The setup is I have 9 metrics, but only the Inspection team is allowed to view the 9th metric.
Rather than build and maintain 2 different dashboards for 2 different user groups, we can use DZV based on who is looking at the report.
The set up here is my Tableau Cloud has 2 users, only 1 of them belongs to the Inspection team:
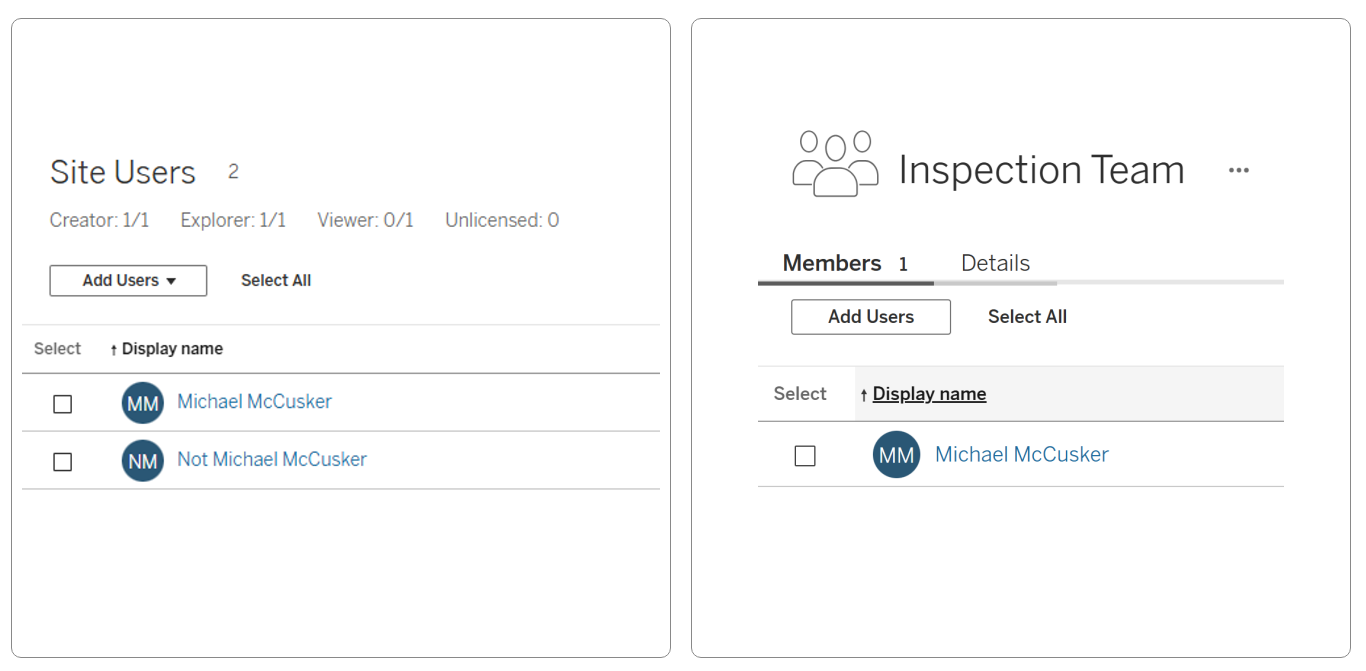
This time, I don't need a parameter. The calculation the checks who is signed in is a True/False calculation and is independent of the data. So we can use it directly to apply DZV to the inspection metric.
This uses a cool feature of mimicking another user on your cloud. As you have to be logged into my cloud to make it work, this won't work for you, but you can see how it put together.
Because this example uses User-based calculations, it cannot be added to Tableau Public, and doesn't appear in my Tableau Public version of this workbook.
But you can download the full starter and completed workbooks below.
One technique, multiple uses
Those were just a few examples to demonstrate the flexibility of DZV and how easy it is to apply.
Whatever the application, it is always the same 3 steps:
-
Create a Parameter
-
Create a Calculated Field
-
Check the box
What use cases can you come up with? Feel free to tag and share with me.
Resources
Datafam Tableau User Group YouTube Recording