Tableau Data Apps are here. Do you like scary movies?
Tableau Data Apps are here.
Well, kind of. They arrived as a beta with the 2026.3 release. Tableau Cloud only for now, and only on sites that support it, so they're live in some clouds. But they are certainly coming.
First, what they are, how they differ from a viz extension and how to build one. Then an example of a dashboard I built on Halloween all about Scary Movies.
What is a Data App?
A Data App is not just a hosted Viz Extension.
Putting that out there first - because it took me way longer than I care to admit to realise that. I thought I was just getting to host my viz extensions on Tableau Cloud.
They are very similar - but the key difference is that Data Apps are not reusable assets.
A Data App is more like a web app, or an app on your phone - but one that lives inside a workbook. The HTML, JavaScript and CSS all get packed into the .twbx, you publish it like any other workbook, and Tableau serves it from there.
To a viewer, it just looks like a workbook.
A few months ago I said a viz extension is just HTML in a box. Tableau has now put the box inside the workbook.
A .twbx is a zip file, so you can always peek under the hood and see the workings. Here's mine:
Do You Like Scary Movies.twbx
├── Do You Like Scary Movies.twb
├── Packages/com.michaelmccusker.haunted-top-200/
│   ├── manifest.json
│   ├── extensions/haunted-top-200.trex
│   └── content/            the web app
├── Data/Datasources/Horror Top 200.csv
└── Resources/.agents/      notes for the AI
Early iteration of the build didn't have title, hence generic haunted-top-200 placeholder
That last folder is part of Tableau's own template. The AI's notes travel with the workbook too.
The app runs in the viewer's browser and asks Tableau for data as it runs. That data can be a published data source, which keeps your extract refreshes and row-level security, or a file packed inside the workbook.
How is that different from a viz extension?
A Data App is still an extension underneath.
What changes is everything around it.
Hosting. Back in June, I wrote this about building your own extension:
You built it, you host it.
Every viz extension I built before this needed somewhere to live: a server, an HTTPS address and a .trex file pointing at it. This one is a 148 KB .twbx.
Allow-listing. An admin has to approve and allow every viz extension by whitelisting the URL.
A Data App has no address to list. An admin turns packages on once for the site, and from then on it publishes like any other workbook.
Data. A viz extension draws what's on the Marks card.
Someone drags fields onto the shelves and Tableau hands over the results. A Data App has no shelves. It asks for what it wants in its own code.
It can also call a curated set of Tableau REST API endpoints, if your admin allows them.
Reuse. A viz extension is a chart type.
Any author can add it to any sheet and point it at their own fields.
A Data App is one finished application for one job, and its package belongs to the workbook that carries it. If you want a chart people can reuse, that's still a viz extension.
I published mine to my Personal Space, opened it, and it ran. No hosting. No allow-listing. It's just there, and it travels with the workbook.
Not one mark on that sheet was drawn by Tableau.
A few honest caveats, because it's a beta:
-
If your app calls an outside service, that address does go on an allow list. Mine doesn't call anything.
-
Tableau hosts the front end only. There's no server-side code and no iframes, and your libraries go in the package.
-
Publishing an app doesn't give anyone extra access to your data. Viewers also need API Access on the workbook, and on any published data source behind it.
How to build one
Tableau's getting started guide opens with this:
Create a data app by describing what you want to an AI coding assistant.
Slightly unsettling that the first thing the documentation says 'have AI do it' - but more on that later.
But here's the main points:
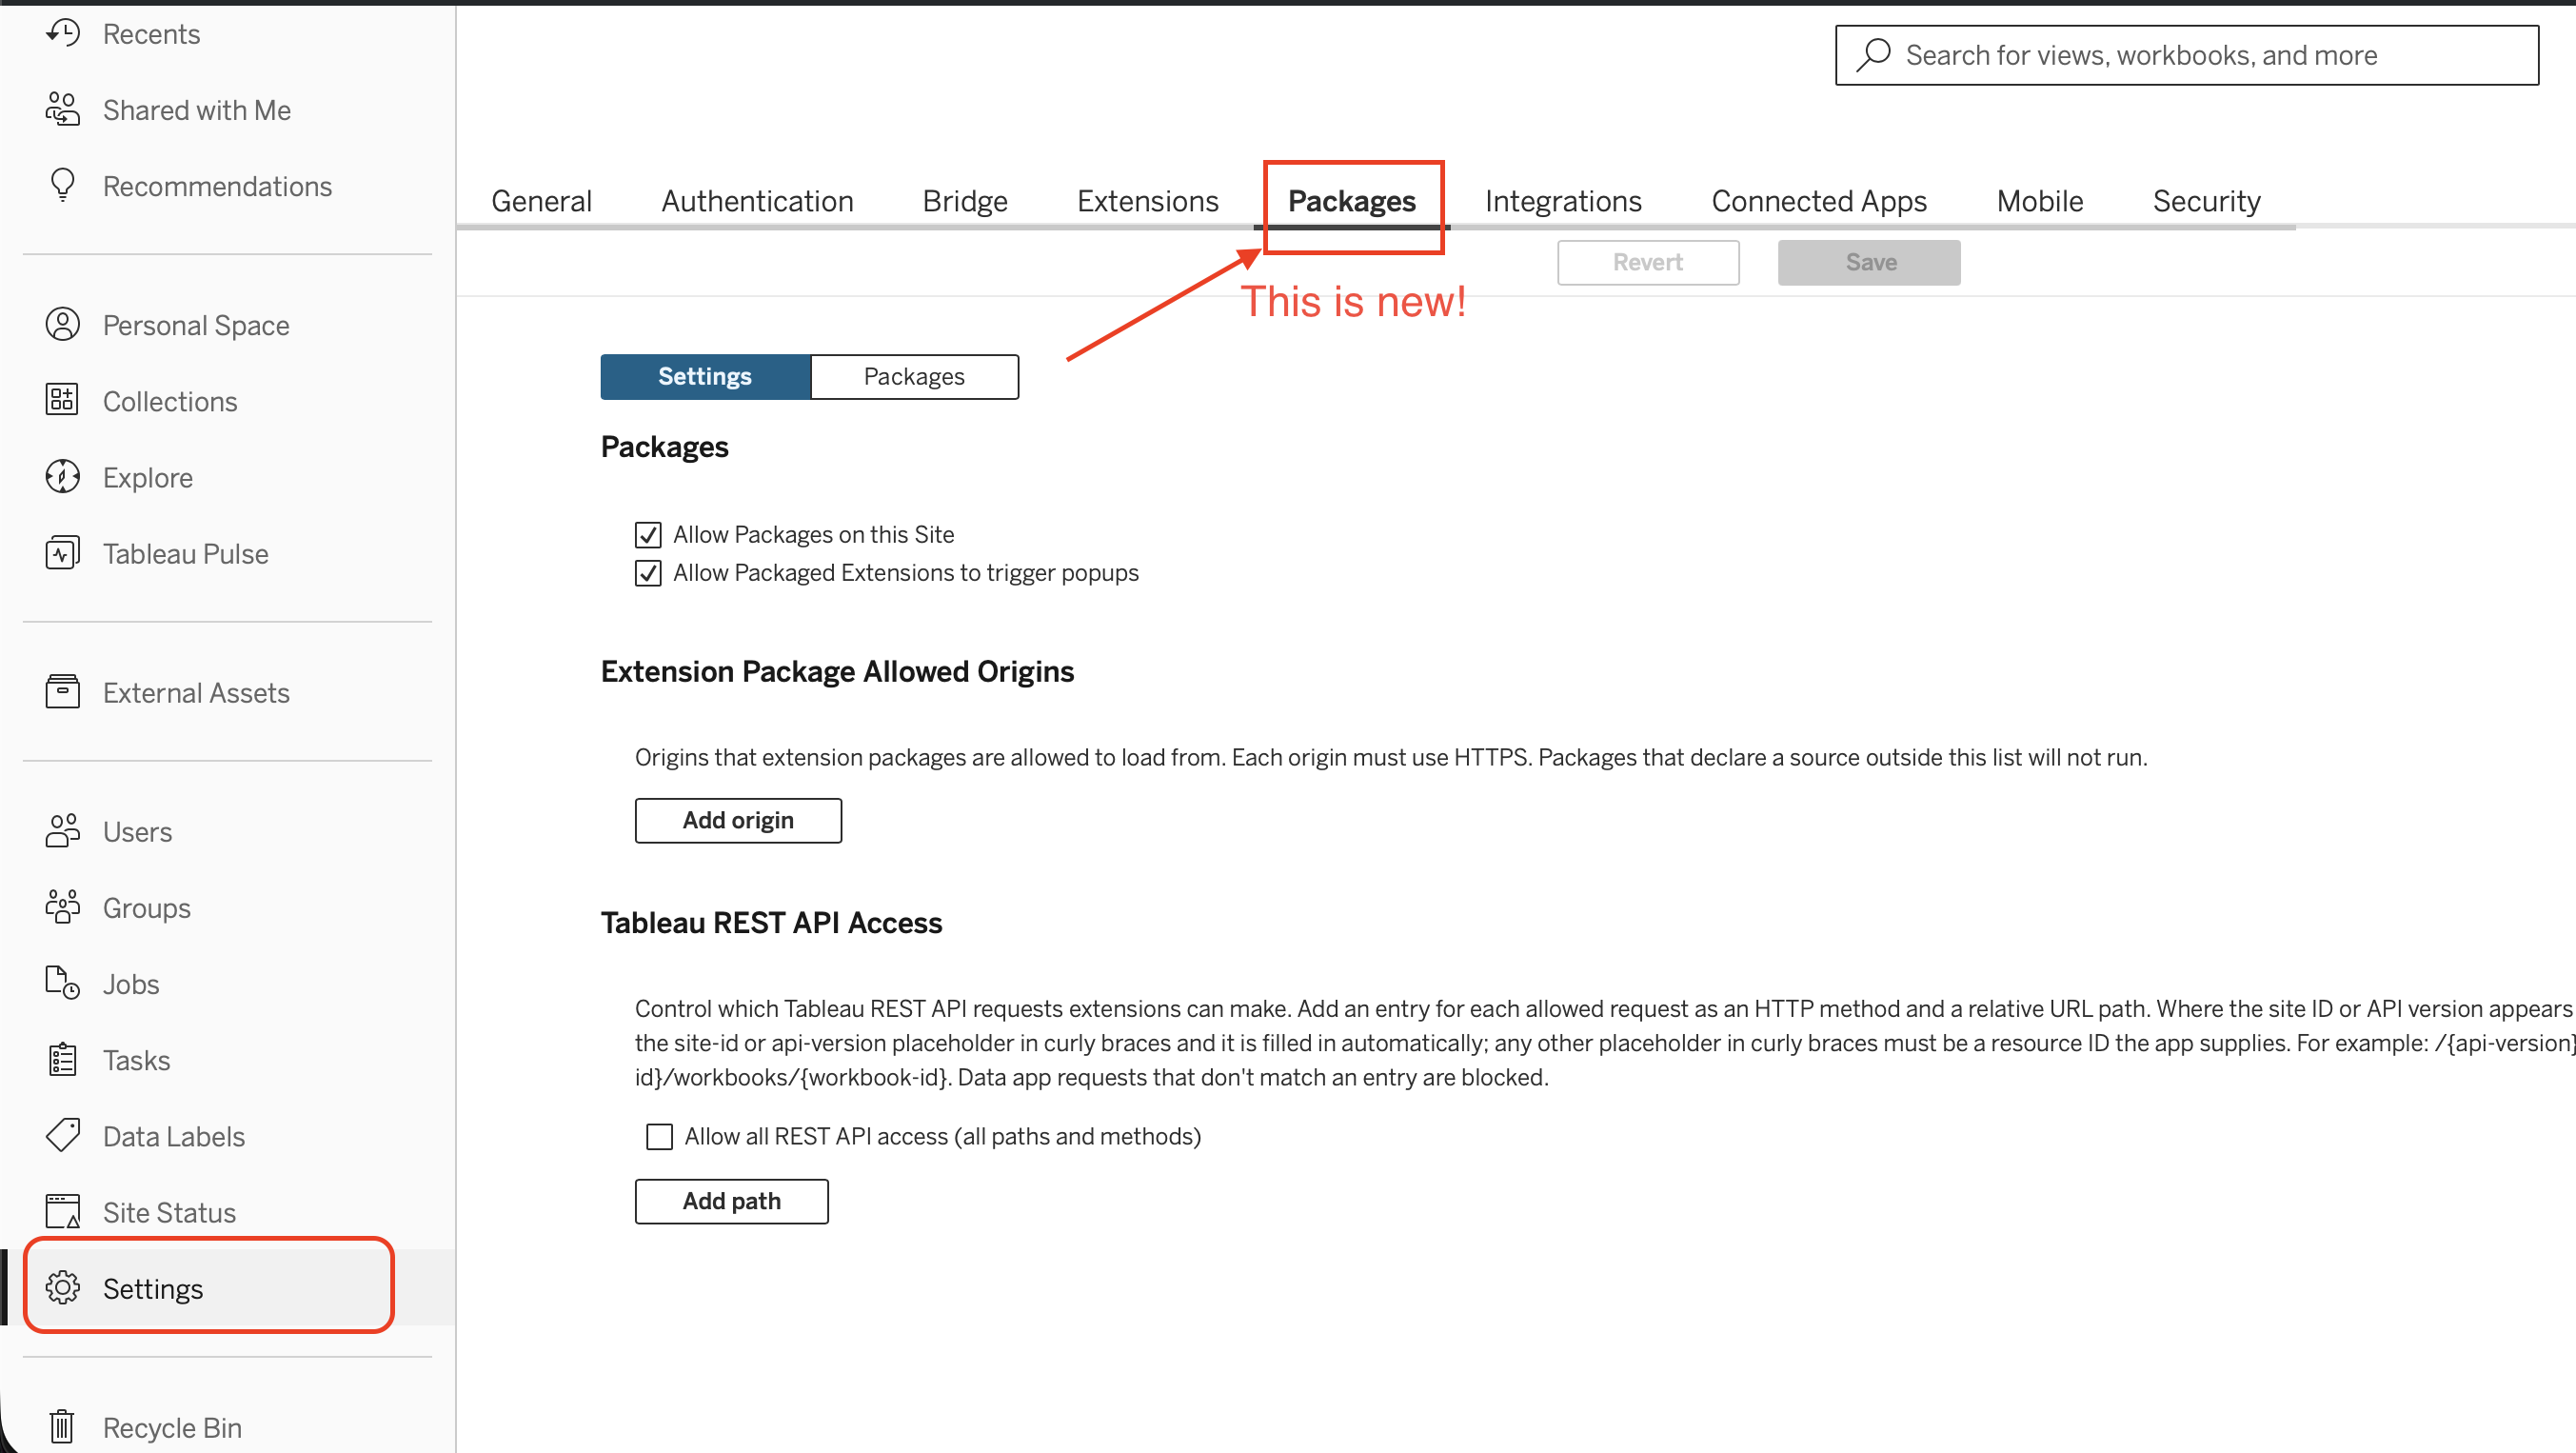
Check your site. You need a Tableau Cloud site that supports the beta, with Allow Packages on this Site turned on under Settings, then Packages.
Build - few ways to do this. Tableau MCP connection, Tableau to AI plug-in. I just opened Claude and gave it directions.
-
Describe the app. Purpose, audience, data source, key metrics, controls, visual style and where to publish it.
-
Let it build. The assistant scaffolds the app, connects your data, writes the interface, packages the
.twbxand publishes it. -
Review it in Tableau. Try every filter, check the empty and error states, and test it as a viewer. Ask for changes in the same conversation. Then review the code before you share it: Tableau is clear that hosting doesn't replace code review, AI-generated code included.
If you'd rather read one first, Tableau's Superstore sample is a full Data App you can pull apart. It needs 2026.3.1 or later.
Do you like scary movies?
I do. So on Halloween, I built this dashboard. (Check out a version of it here without needing a Tableau login: Do you like scary movies)
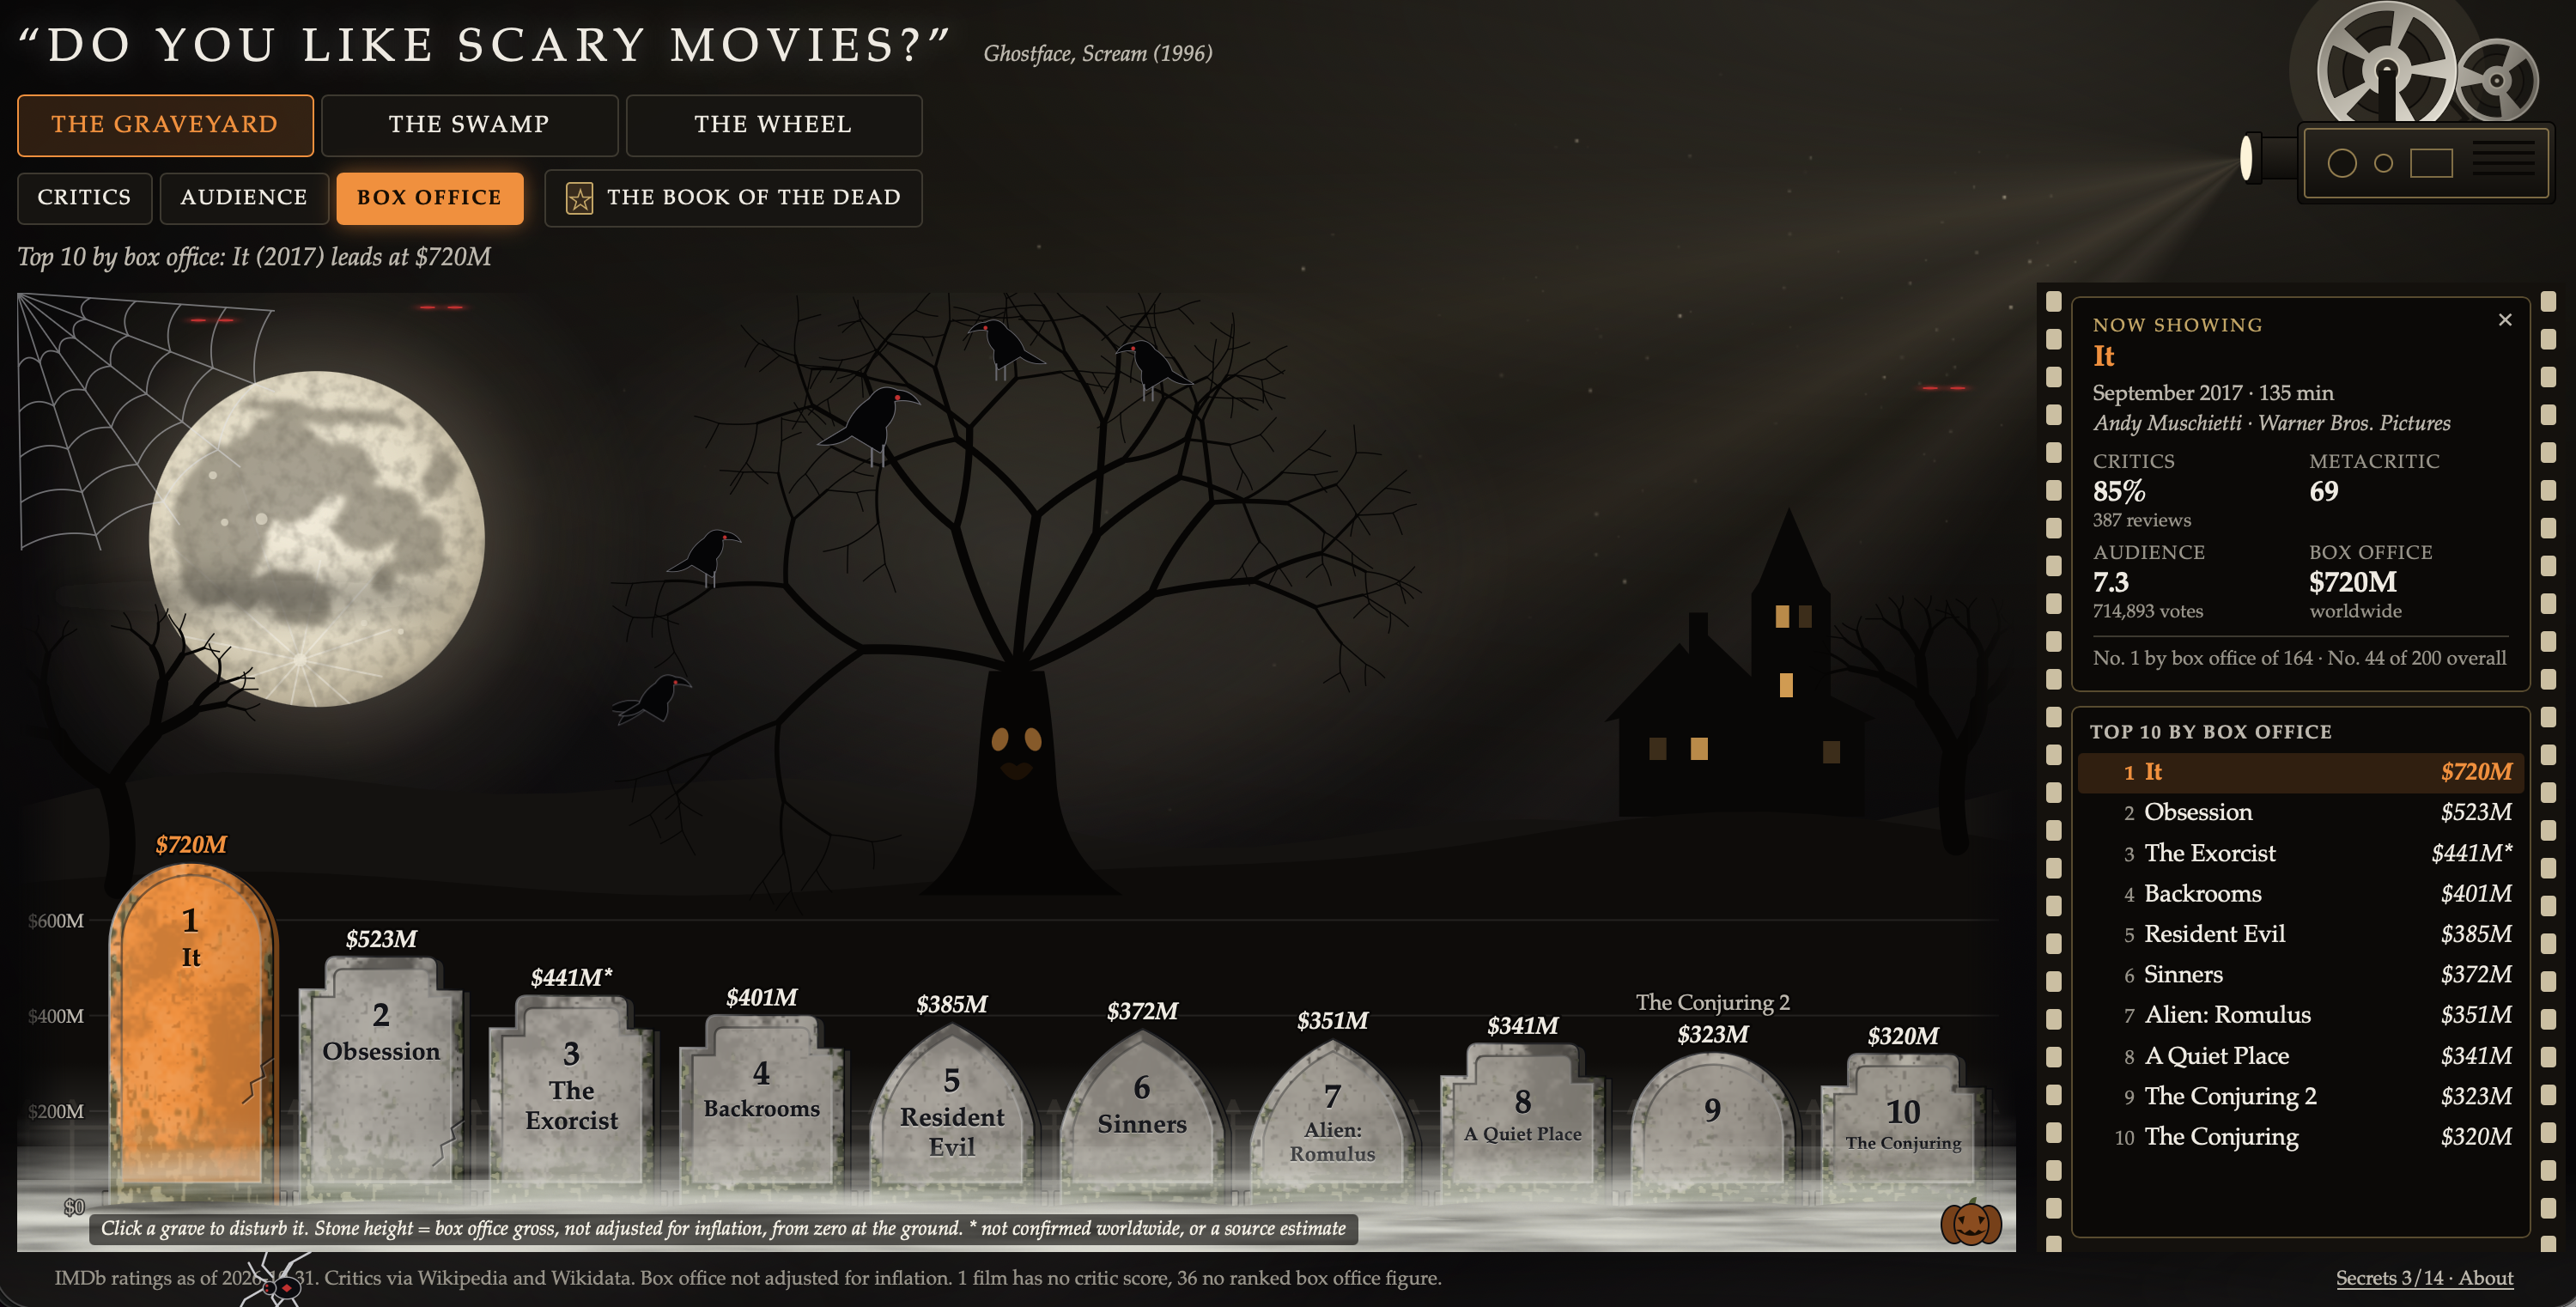
The Graveyard. Tombstones as bar charts. Movie projector motifs.
It started as a little Halloween wheel I made during a quick Tableau Studio hands-on demo (will blog more on that later!). It was cool, but the data was made up.
I wanted the same idea with real movies, so I handed Claude Code the recording of that build and asked for the top 200 horror films, a better chart than a pie, and a spider walking around the screen.
Anyone remember Data + Movies, Tableau and IMDb's community program? This is very much in that spirit, though my data comes from IMDb's non-commercial datasets, with critic scores and box office from Wikipedia and Wikidata.
The result is Do you like scary movies?, with credit to Scream. That link is a copy on my own site so you don't need a Tableau Cloud login to try it: same code, with Tableau swapped out. It's in my portfolio too.
It's also on Tableau Public, though strictly speaking that one isn't a Data App. Tableau Public doesn't support them yet, so I added it as a web object pointing at the copy on my site.
-
The Graveyard: a bar chart in disguise. Each tombstone's height is the film's score, measured from zero at the ground.
-
The Swamp: critics against audience, so you can see where they disagree.
-
The Wheel: can't pick a movie? Spin it.
I then loaded it up with Easter Eggs, Animations and non-Tableau-native features. At this point, I'm just trying to see if I can break it. Adding things I think Tableau will not like. Then I tried to make a pie chart look cool.
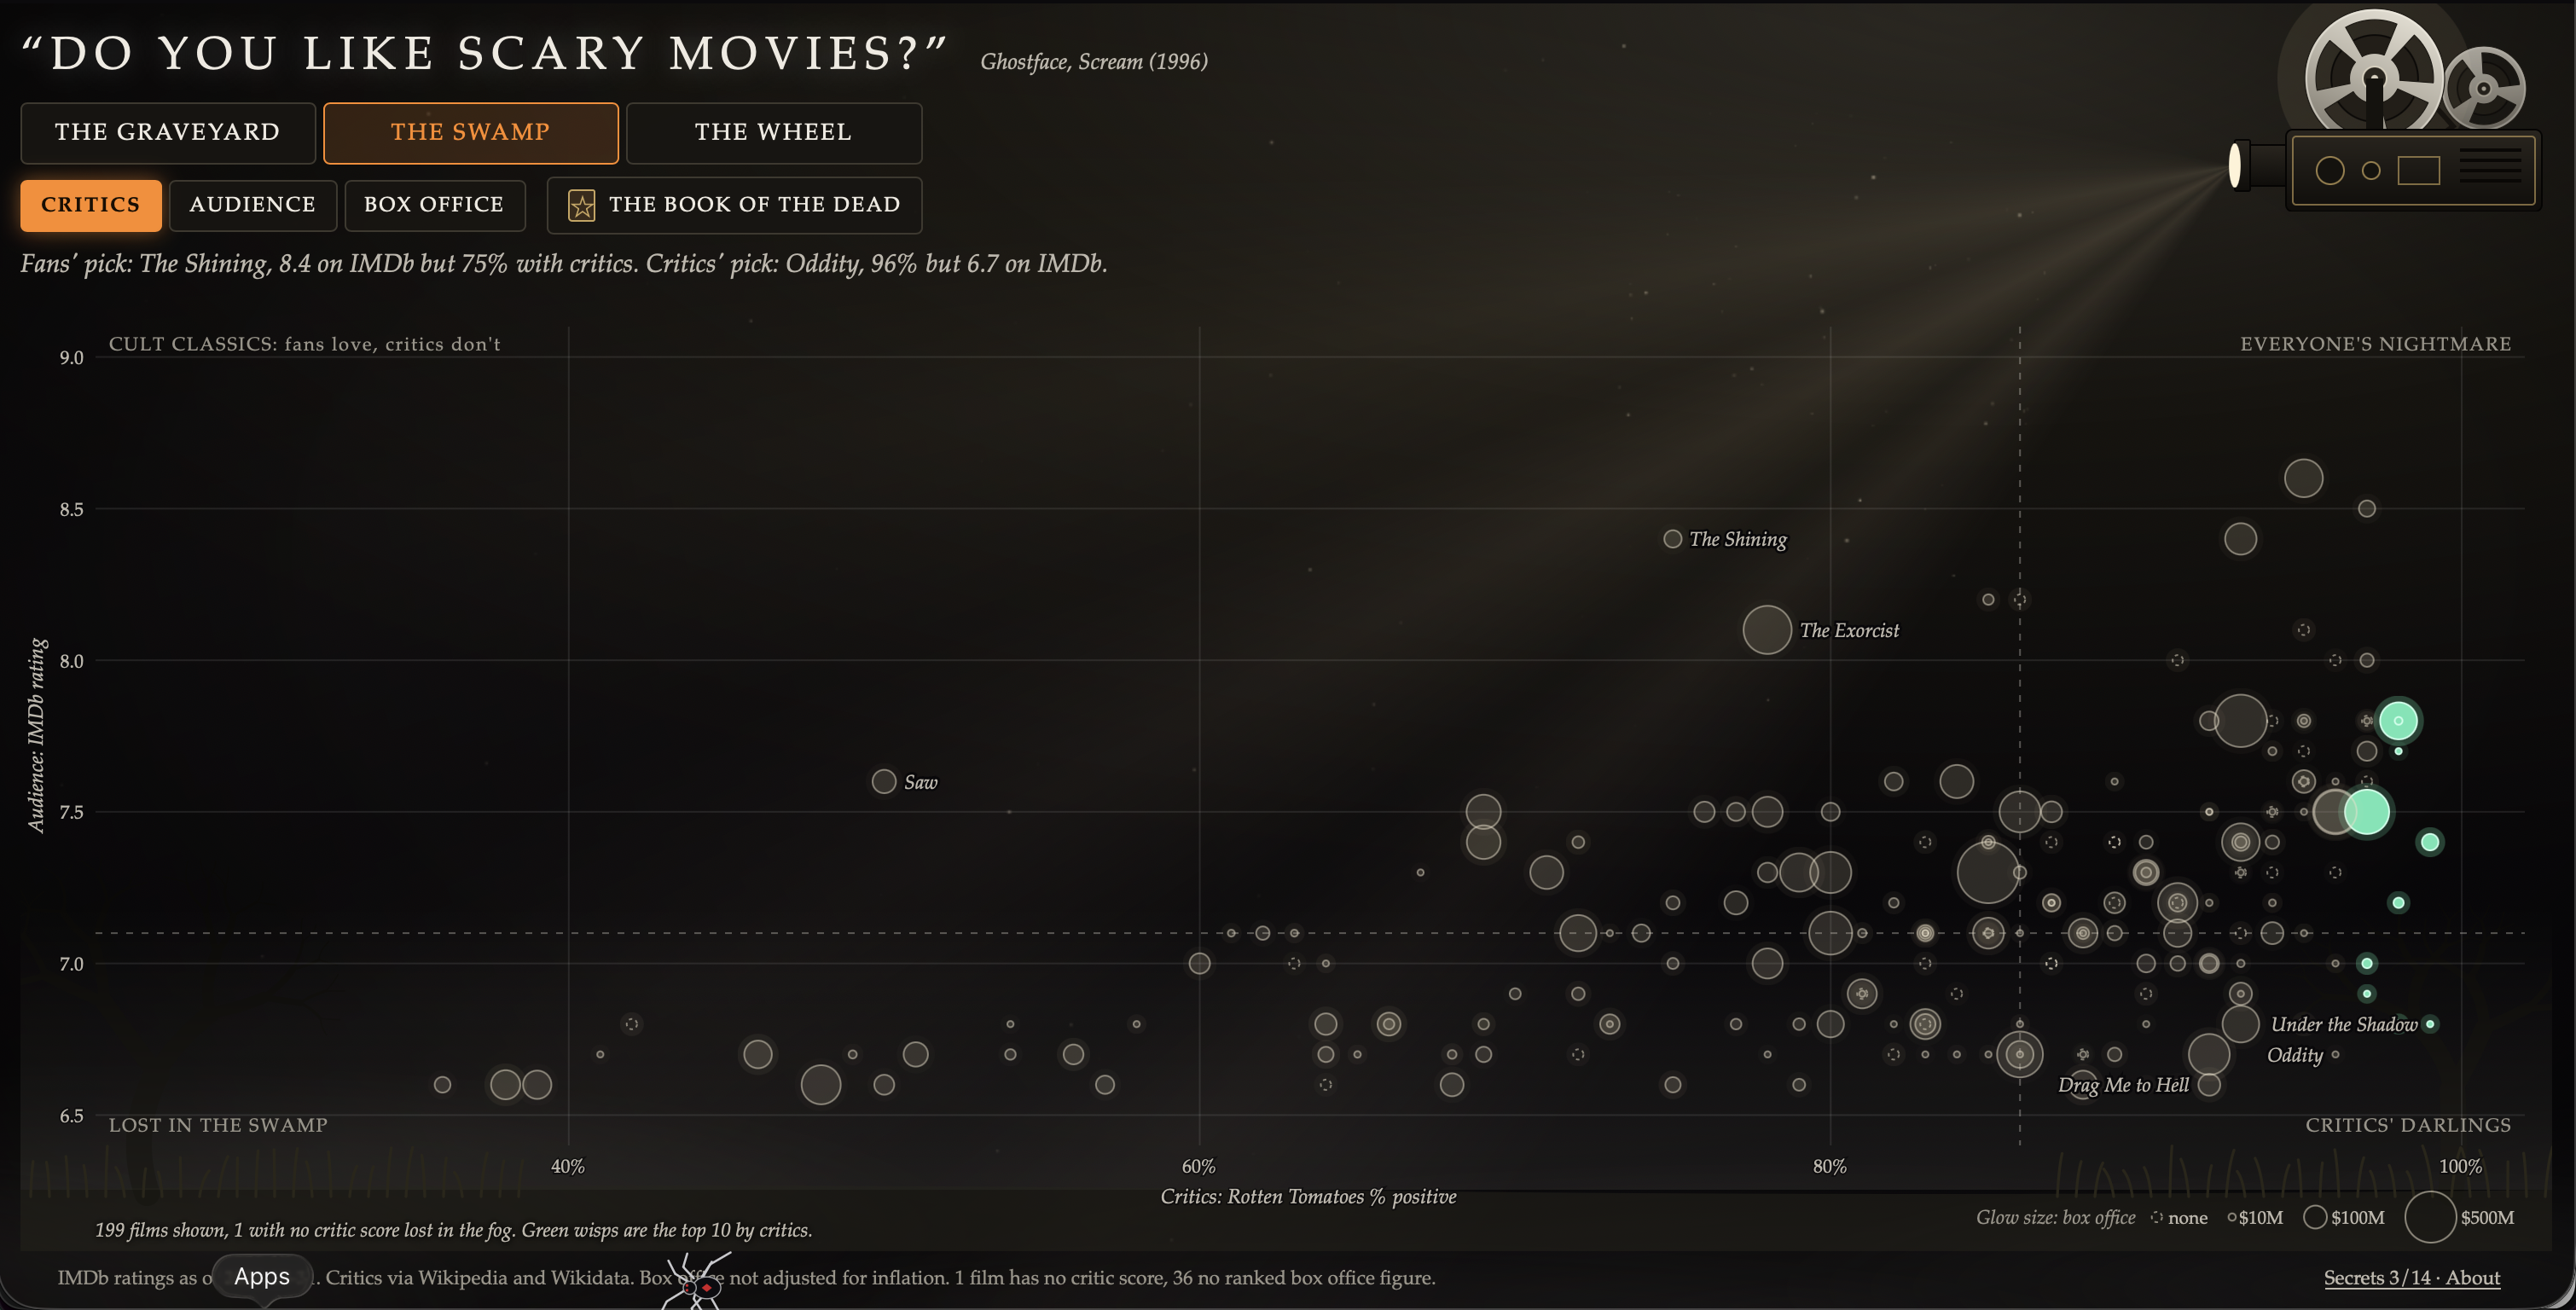
Comparing how critics' and audiences' opinions line up
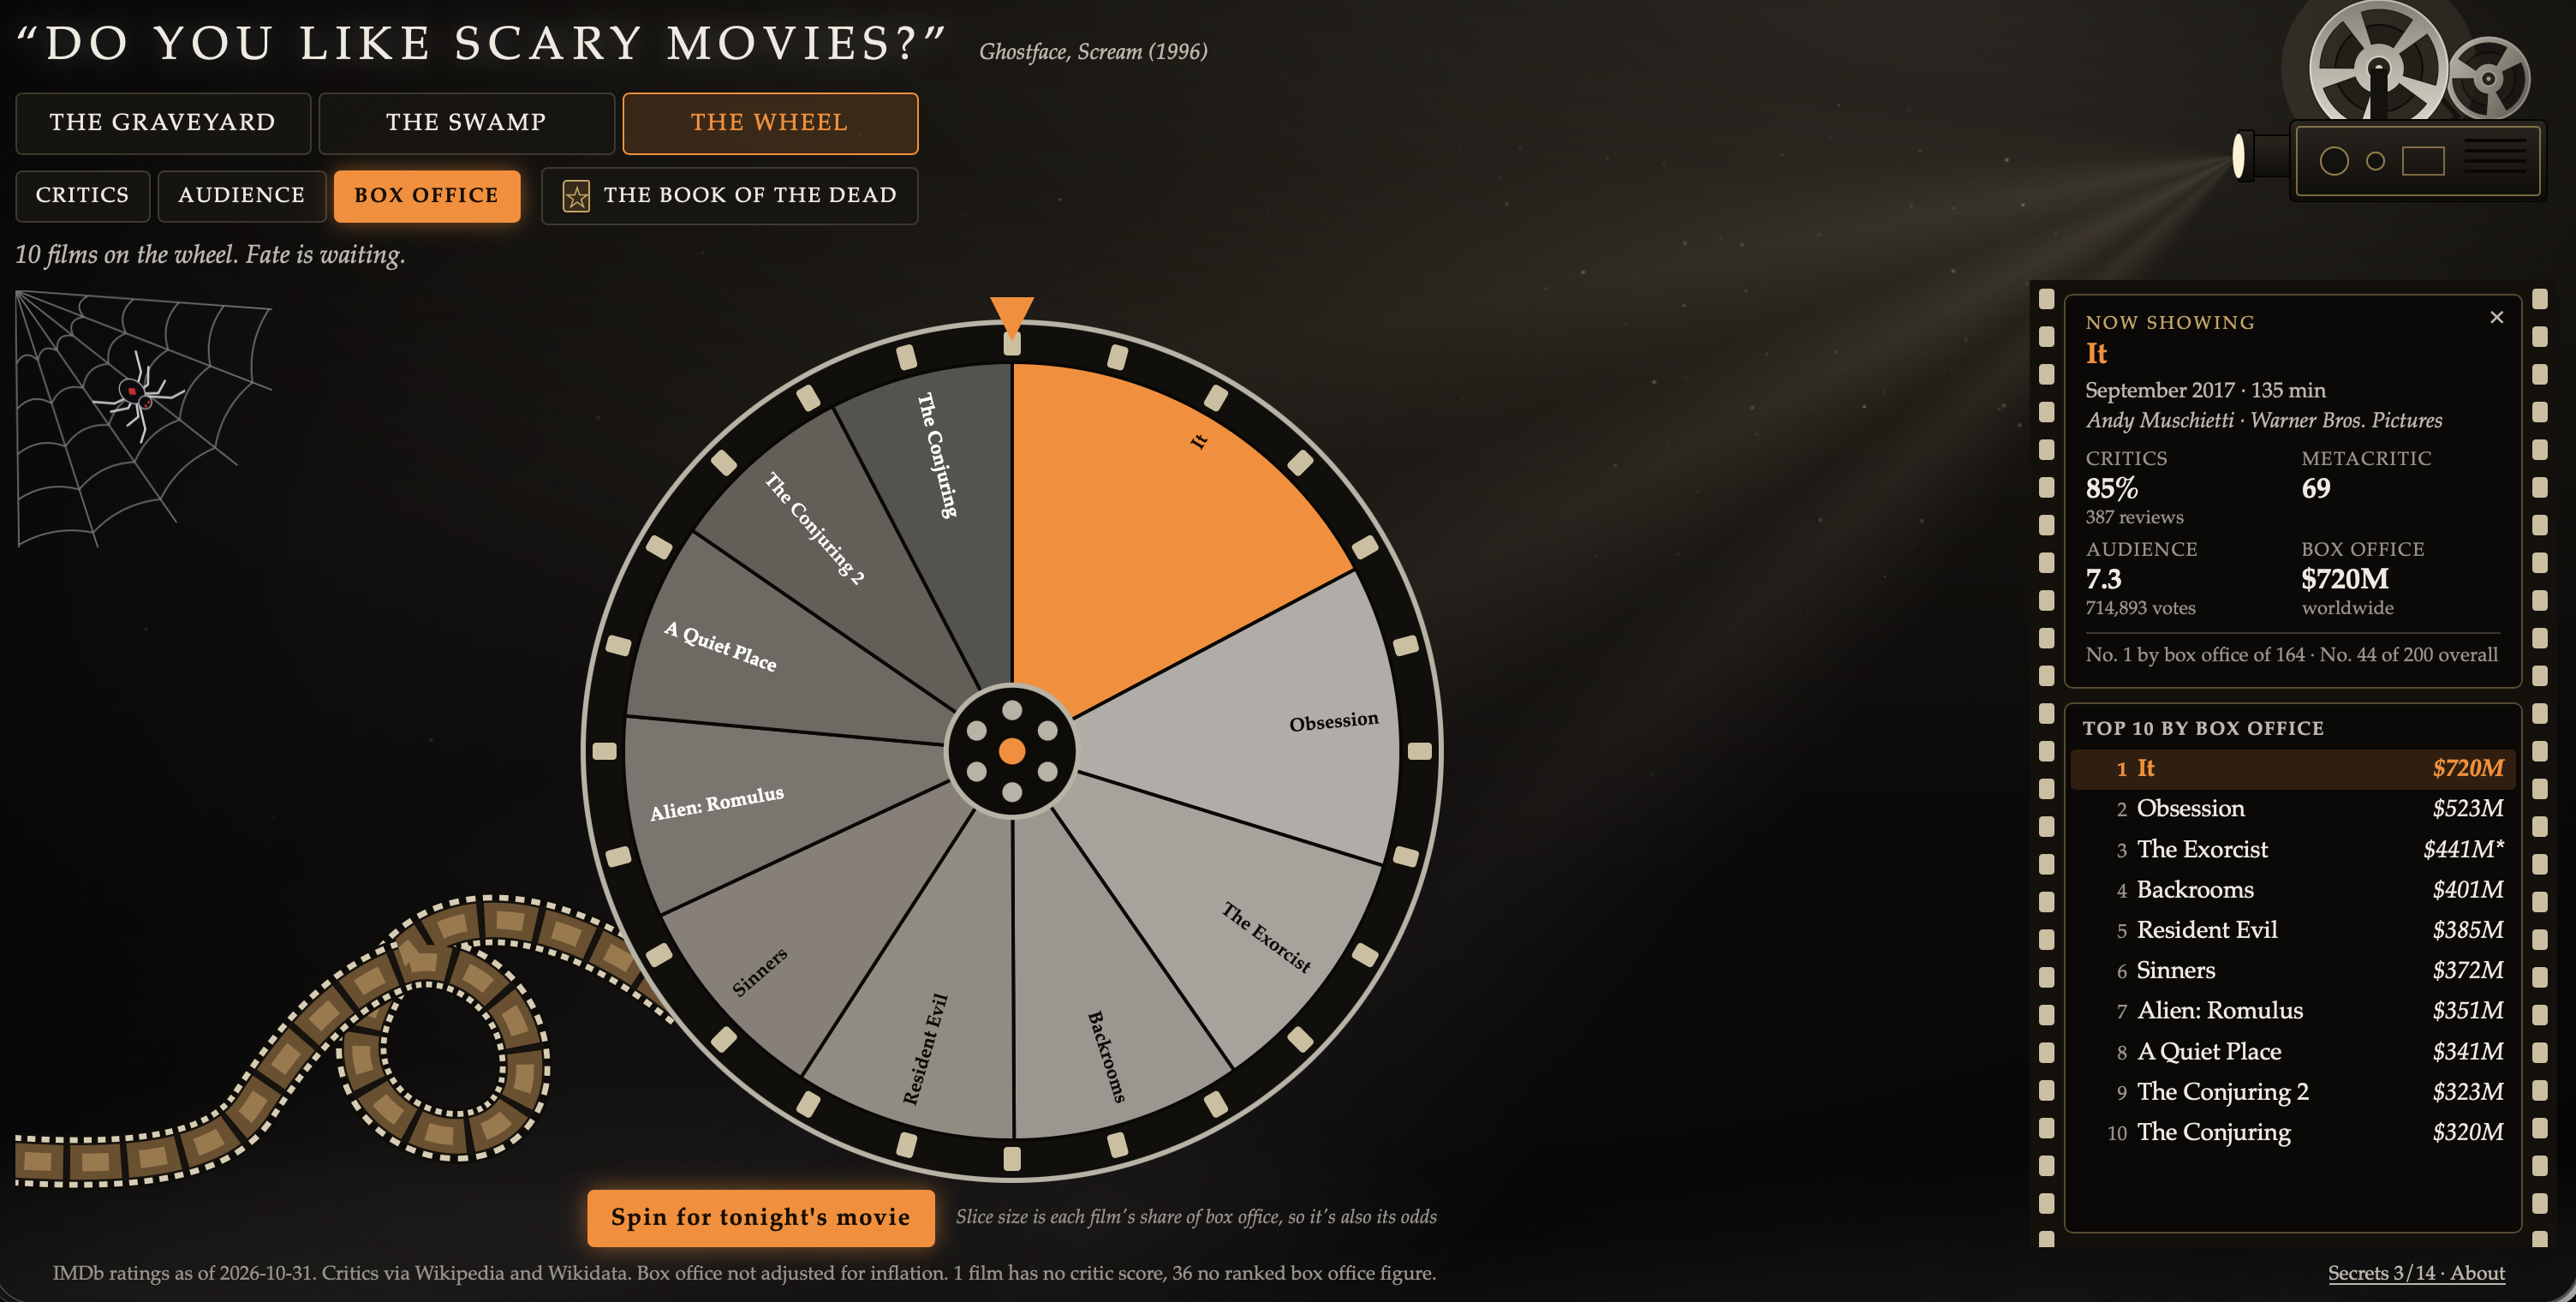
Normally I have a no-pie-chart rule in my builds, but maybe this is an exception
And here's the final product sitting on Tableau Cloud. It's not hosted anywhere else, no .trex files, no https://. To my end user, this is just another Tableau build.
Optimizing your prompt: The loop
Recently I learned about the /loop skill in Claude. What a game changer.
My first prompt ended like this:
Have an agent assess the v1 and give feedback. Then /loop through to address their feedback and do that until we have a prod ready data app.
/loop is a Claude Code command that runs a prompt over and over. Give it no interval and Claude paces itself, and keeps going until the job is done.
The job here was one review round. A second agent, with no part in the build, checks the app against a production checklist. Claude fixes every blocker and major issue, checks the fixes live on Tableau, writes it all in a log and goes again. It stops when a round comes back with no blockers and no majors.
Five rounds:
-
Round 1: 2 blockers, 11 majors
-
Round 2: 1 blocker, 5 majors
-
Round 3: 1 blocker, 3 majors
-
Round 4: 1 blocker, 3 majors
-
Round 5: no blockers, no majors
Round 4 is my favorite. Three rounds had already been through the box office numbers. Then the reviewer read the citations behind all 177 box office figures, and found the catch in the footnotes. Five films were showing rentals as if they were gross. Scanners said $6.3M. It actually grossed $14.2M.
Nothing on the page looked wrong. I would never have found that.
A loop is only as good as its stop condition. "Keep improving it" is an expensive way to run in circles. "No blockers, no majors, against this checklist" is a finish line.
Important: this is a great way to burn through tokens. Use with caution.
The call is coming from inside the house
Horror movies are scary and play off our anxieties and fears. So why are they so popular and why don't we look away? They are also exciting.
The call is coming from inside the house.
I see some parallels with being a Tableau developer right now. AI is building dashboards - and that's sort of my job.
I've spent 6 years learning this tool. Calculations, LODs, Map Layers, Dynamic Zone Visibility. A Data App uses none of it.
Today, I described something in plain English and it showed up in Tableau Cloud as a polished dashboard in a single day.
Are Tableau themselves making these core Tableau skills less important? Is the call coming from inside the house?
Custom web apps used to live outside Tableau, built by someone else, somewhere else. Now one is sitting inside a workbook, I didn't have to be a web developer to put it there, and Tableau's own guide tells you to start by describing it to an AI.
I'm not sure what this means for Tableau developers going forward, but like scary movies, I am finding it kind of exciting and exhilarating. Things are undeniably changing, so explore and learn new things. Each new release is a jump scare and I am undeniably nervous - but I'm still enjoying the experience, learning new things and I'll just keep building.
Ideas; not syntax
In November, there are lots of learning opportunities for Tableau Studio and Data Apps.
Nov 4 | Tableau Data Apps: Vibe code analytics with any agent - host and scale on Tableau
Nov 10 | Tableau Learning Fest: Tableau Builder & DataDev LIVE!
Nov 18 | LinkedIn Live: Meet Tableau Studio
And during a demo like these, Kyle Massey used 2 phrases which hit home for me.
-
Syntax; not ideas
-
Human at the Helm
Both mean that Tableau is trying to build an experience where they are supercharging the developer rather than replacing them.
I found this very useful. Do you want to spend your time tracking down a rogue comma that's breaking the code, or focus on connecting your stakeholders' business needs, the data, the workflow and the user experience with the dashboard?
Few things to note
Check your site. Ask your admin to look under Settings, then Packages. You might already have this.
Write the stop condition first. Before you start any loop, decide what done means.
Don't let the builder mark its own homework. The agent that wrote the code isn't the one you want reviewing it.
Keep your taste. The loop will tell you it's broken. It won't tell you it's boring.
Information courtesy of IMDb (https://www.imdb.com). Used with permission. A personal, non-commercial project.